Comparative Analysis of Monthly Reports on the Oil Market
1. International Policy and Market Context
Pakistan, Sri Lanka face ongoing energy shortages
- Europe’s aim to substitute energy imports from Russia and weak support for new upstream investment redirects available energy supply away from non-OECD economies with limited buying power where prices have continued to rise sharply. On 1 July 2022, Pakistan put forth a tender for seeking 10 shipments of LNG on the spot market for delivery from July to September but was unable to secure an LNG tender for the 4th time in roughly a month. Sri Lanka, meanwhile, is in its worst financial crisis in seven decades, with dollar reserves to pay for essential imports including fuel all but depleted.
G7 explores price caps on Russian oil
- On 28 June 2022, the Leaders of the Group of Seven (G7) met in Germany to reemphasize their condemnation of Russia’s invasion of Ukraine and reaffirm their commitment to “phase out our dependency on Russian energy, without compromising on our climate and environmental goals.” G7 leaders explored the feasibility of capping Russian oil prices, to prevent Moscow from profiting from jumps in prices due to the invasion of Ukraine. Any price cap would require collaboration among key producers and consumers including India and China that already benefit from discounted Russian oil.
Russia takes full control of Sakhalin-2 gas project
- On 30 June, Russian President Vladimir Putin signed a decree that orders the creation of a new company that takes ownership of Sakhalin Energy Investment Co. Shell, Mitsui and Mitsubishi, hold just under 50 percent of the project while Gazprom, owns the rest. According to the decree, Gazprom will keep its controlling stake, but foreign companies can only regain their assets by applying for a stake in the new firm within one month. If denied, proceeds from assets sold will be retained to compensate the Russian government for damages. The move raises security of gas supply questions in Asian markets and further unsettles an already tight global LNG market.
Norway strike shuts down oil and gas fields further pushing up prices
- On 5 July, Norway’s energy company, Equinor, temporarily shut down three oil and gas fields in the North Sea due to a worker strike, intensifying regional supply troubles and pushing European oil and gas prices to a four-month high. The strikes will affect 89,000 kboe/day of production at fields augmenting risk of disruptions that could cut the country’s daily gas exports by 13 percent. Benchmark front-month futures contracts tied to TTF jumped to their highest level since early March trading at a fivefold increase compared to last year.
OPEC and non-OPEC countries stay the course on production
- On 30 June, OPEC and non-OPEC countries agreed to reconfirm the production adjustment plan and the monthly production adjustment mechanism approved at the 19th and 29th OPEC and non-OPEC Ministerial Meetings and the decision to adjust upward the monthly overall production for the month of August 2022 to 648 kb/d. The OPEC+ production plan for September will be announced at the next ministerial meeting, which is to convene on 3 August 2022.
2. KEY POINTS
2.1 DEMAND
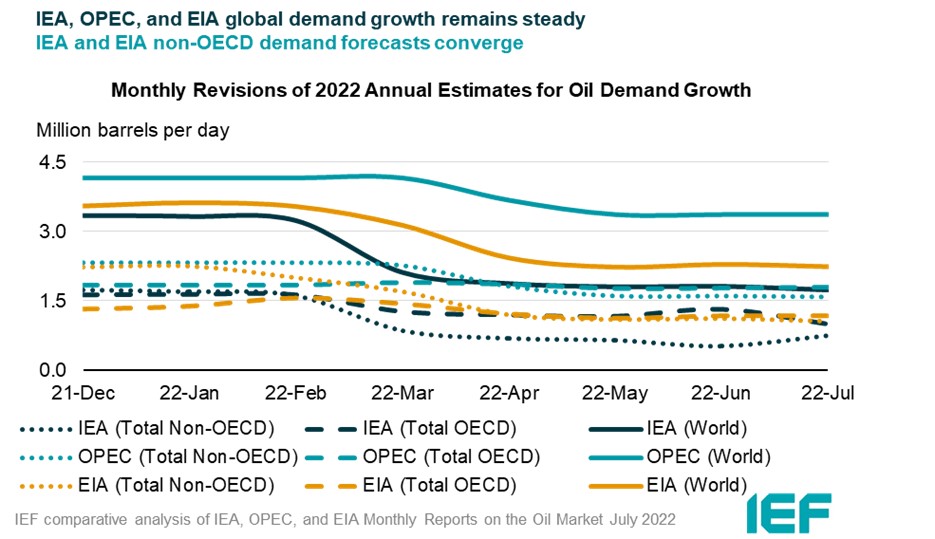
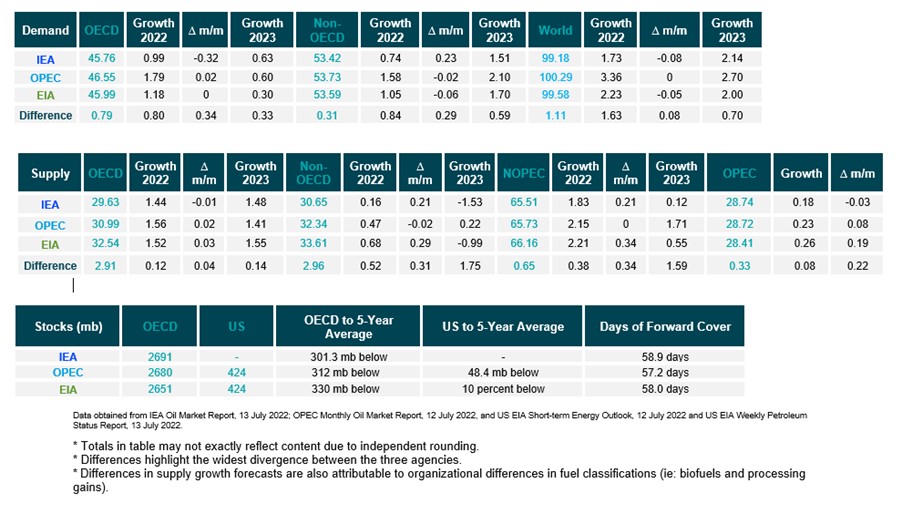
The IEA expects lower demand growth than OPEC and the EIA in 2022.
- IEA’s demand growth assessment for this year drops by 80 kb/d to 1.73 mb/d year-on-year (y-o-y). Growth will accelerate to 2.14 mb/d in 2023.
- OPEC’s y-o-y forecast remains the same at 3.36 mb/d.
- EIA’s assessment falls by 50 kb/d for a growth of 2.23 mb/d this year. The IEA, OPEC, and EIA estimates for absolute world demand are now 99.18 mb/d, 100.29 mb/d, and 99.58 mb/d for 2022, respectively.
The IEA and OPEC diverge on OECD and non-OECD demand growth in 2022.
- The IEA's assessment of y-o-y non-OECD demand growth falls by 320 kb/d to 0.74 mb/d, while OPEC’s estimate falls by 20 kb/d to 1.58 mb/d. EIA non-OECD demand growth falls by 60 kb/d to 1.05 mb/d.
- The IEA's estimate for OECD demand growth falls by 320 kb/d to 0.99 mb/d for 2022 while OPEC’s projection rises by 20 kb/d for a growth of 1.79 mb/d. EIA demand growth remains the same at 1.18 mb/d.
- The largest divergence in OECD and non-OECD demand growth estimates are between IEA and OPEC at 0.80 mb/d and 0.84 mb/d, respectively.
2.2 SUPPLY
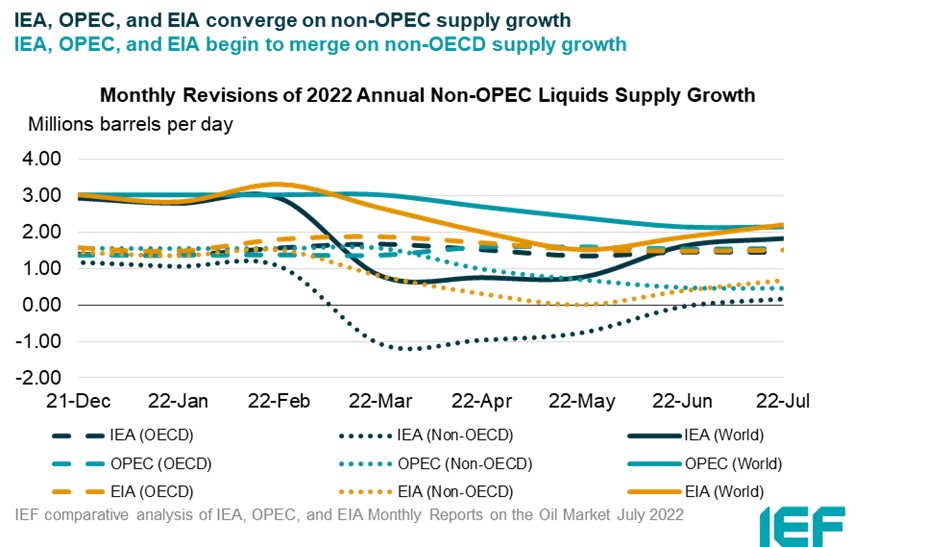
The IEA, OPEC, and the EIA report similar growth in non-OPEC supply.
- The IEA’s July assessment for non-OPEC supply rises by 210 kb/d to reach a growth of 1.83 mb/d while OPEC’s estimate remains the same at 2.15 mb/d. The EIA’s assessment rises by 340 kb/d for an overall growth of 2.21 mb/d. In absolute values, the IEA, OPEC, and the EIA estimate non-OPEC supply at 65.51 mb/d, 65.73 mb/d, and 66.16 mb/d, respectively for 2022.
- The IEA estimates OECD oil supply growth this year at 1.44 mb/d, OPEC pegs it at 1.56 mb/d, and EIA reports growth at 1.52 mb/d, a decrease of 10 kb/d and increases of 20 kb/d, and 30 kb/d, respectively. In absolute terms, the IEA, OPEC, and the EIA estimate OECD oil supply at 29.63 mb/d, 30.99 mb/d, and 32.54 mb/d, respectively for 2022. The divergence between OECD supply growth estimates of the IEA and OPEC is 120 kb/d.
The IEA forecasts less non-OECD supply growth compared to OPEC and EIA in 2022.
- The IEA’s assessment for non-OECD supply rises by 210 kb/d to a total growth of 0.16 mb/d in 2022.
- OPEC revised down its forecast by 20 kb/d to a growth of 470 kb/d while the EIA revised its non-OECD growth forecast upwards by 290 kb/d to a growth of 680 kb/d.
- In absolute values, the IEA, OPEC, and the EIA non-OECD supply estimates are 30.65 mb/d, 32.34 mb/d, and 33.61 mb/d, respectively for 2022 with the largest divergence in growth estimates between the IEA and EIA at 0.52 mb/d.
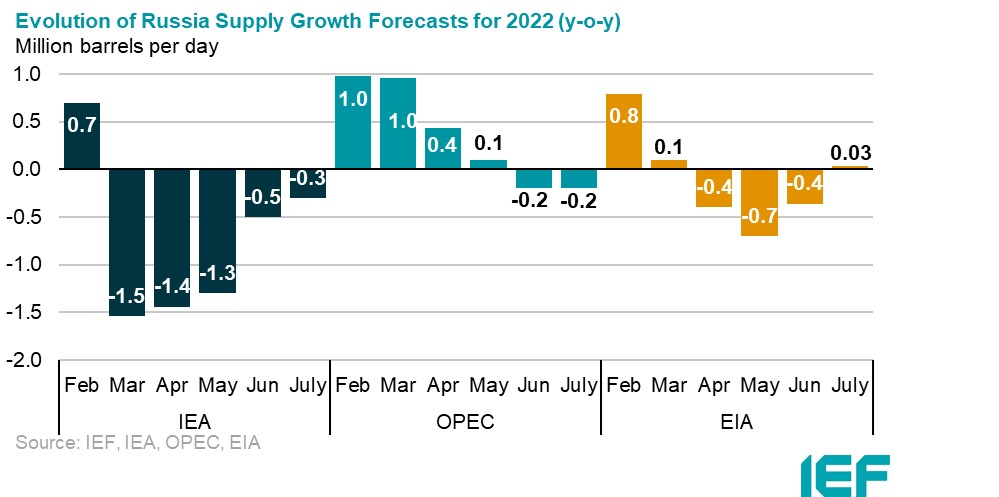
The IEA, EIA, and OPEC revise OPEC production estimates.
- The IEA increased its OPEC production estimate for June by 180 kb/d month-on-month (m-o-m) to reach total production of 28.74 mb/d.
- OPEC also revised its assessment of OPEC production upward by 230 kb/d to 28.72 mb/d.
- The EIA revised its assessment upward by 260 kb/d with total OPEC crude production reaching 28.41 mb/d.
2.3 STOCKS
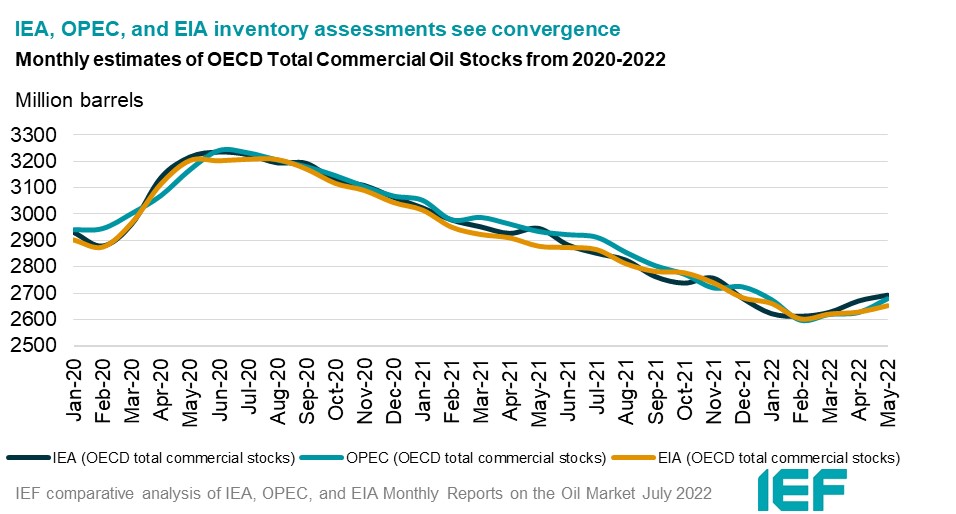
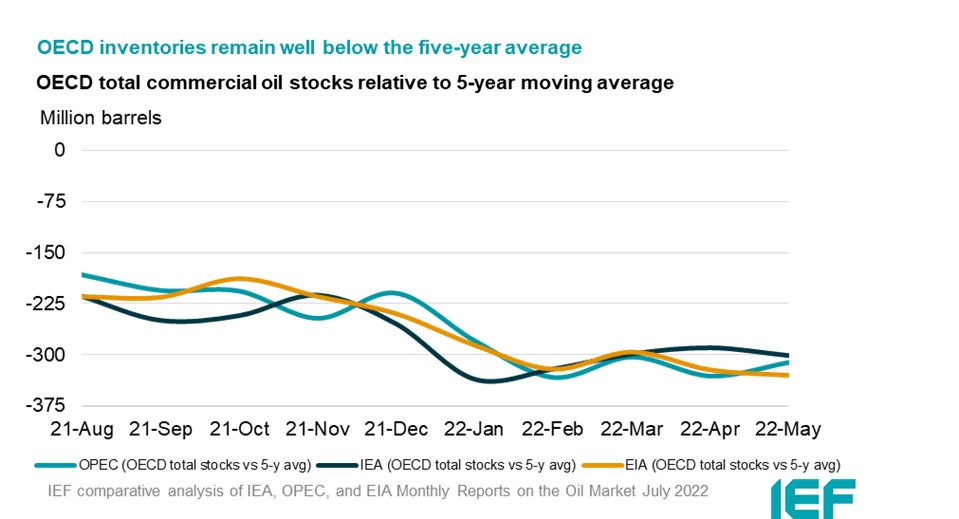
The IEA, OPEC, and EIA continue to display strong alignment on stock figures which are below the five-year average and now below 60 days forward cover.
- The IEA reports OECD stock levels at 2691 mb, which is close to OPEC’s assessment of 2680 mb and EIA’s assessment of 2651 mb. These are around 301 mb, 312 mb, and 330 mb below the five-year average, respectively.
- According to the IEA, crude oil inventories built by 6.8 mb while product stocks built by 7.1 mb. Other oils, including NGLs and feedstocks built by 1.3 mb. According to OPEC, crude oil stocks drew by 6.7 mb while products built by 17.2 mb.
- The EIA estimates OECD inventories rose by 11 mb in April to 2651 mb – 330 mb below the five-year average.
- The widest divergence in inventories is between the IEA and EIA at 40 mb. Total US crude inventories (excluding SPR) amount to about 424 mb, according to the EIA, which is 10 percent below the five-year average for this time of year.
2.4 Snapshot (mb/d)
3. Global Analysis