")

Comparative Analysis of Monthly Reports on the Oil Market
1. International Policy and Market Context
US announces policies and funding for decarbonization and clean technologies
- On 8 March, US Secretary of Energy Jennifer Granholm announced two main policies related to clean energy. The Pathways to Commercial Liftoff aims to reduce regulatory barriers for four key technologies including clean hydrogen, advanced nuclear, carbon management, and long duration storage. The DoE is also committing $6 billion to accelerate industrial decarbonization projects, providing the US with a competitive edge in developing the world’s least carbon-intensive iron and steel, aluminum, cement, concrete, glass, pulp and paper, industrial ceramics, and chemicals. Secretary Granholm stated that oil and gas will remain a part of the energy mix for years to come and energy companies must step up to build critical technologies at scale.
US approves $7 billion oil project in Alaska
- On 13 March, the US approved the ConocoPhillips oil and gas drilling Willow project in Alaska. The scaled-back version of the project includes three drill sites and less surface infrastructure than originally proposed to reduce environmental risk. Located in the National Petroleum Reserve in Alaska, the Willow project is estimated to produce 180 kb/d at its peak and projected to deliver between $8 billion to $17 billion in new revenue for the federal government, the state of Alaska, and local communities.
SVB Bank collapse impacts clean technology investment
- On 10 March, Silicon Valley Bank faced a sudden bank run and capital crisis and was subsequently taken over by federal regulators. SVB’s lending portfolio consists of clean technology start-ups and smaller projects considered too risky for traditional banks, and its collapse further limits the ability of such projects to attract capital on US Federal Reserve rate increases. While US regulators have stepped in to enable investors and company founders to access their funds, the failure creates a more challenging and uncertain financial landscape amidst persistently high inflation and recession fears. The banking collapse is the largest failure of a US bank since the 2008 Financial Crisis.
India invokes emergency law to boost coal-based power
- On 20 February, India invoked an emergency law to force power plants that run on imported coal to maximize output ahead of an expected record surge in power usage this summer. Power plants that use imported coal have not functioned at full capacity due to the difficulty of competing with power generated from inexpensive domestic coal. The directive comes into effect on March 16, giving plants the time to import coal ahead of the expected surge in consumption and would remain valid till 15 June.
EU carbon price hits record high at 100 euros
- On 21 February, the cost of European pollution permits rose to €100 for the first time boosted by an improving economic outlook. The surge in carbon prices comes as policy makers work to tighten the EU’s cap-and-trade system to help the bloc deliver on a goal to slash emissions 55 percent by the end of the decade from 1990 levels. Prices were driven up due to expectations of colder weather and low wind speeds that increased the demand for permits from fossil fuel power generators. EU companies have an April deadline to buy and submit enough permits to cover last year’s emissions.
2. KEY POINTS
2.1 DEMAND
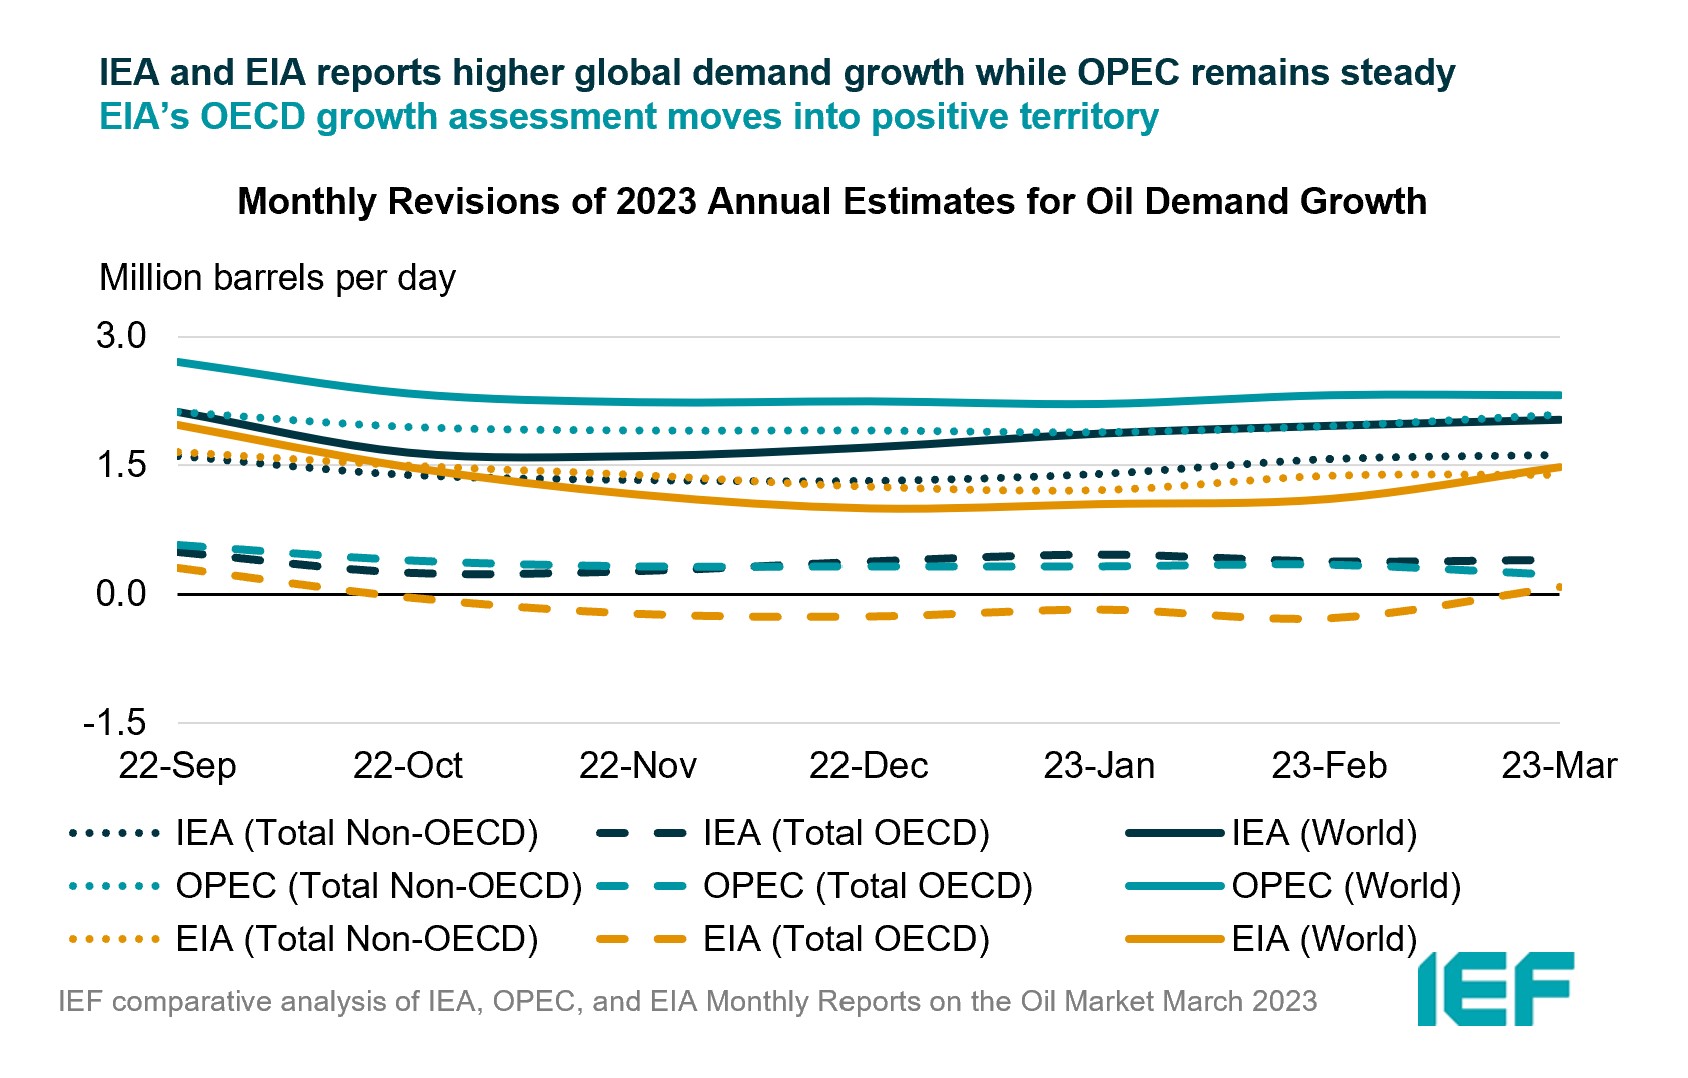
IEA and EIA demand growth rises for 2023 while OPEC estimates remain steady.
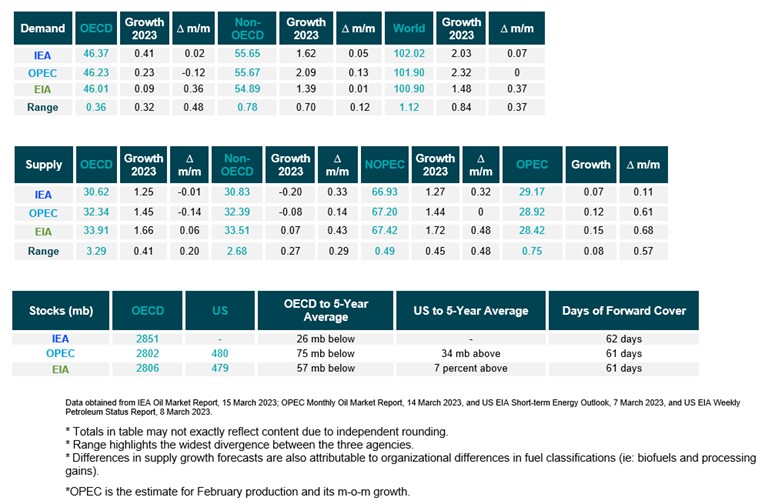
- The IEA and EIA year-on-year (y-o-y) demand growth assessments for 2023 rise by 70 kb/d and 370 kb/d to 2.03 mb/d and 1.48 mb/d, respectively.
- OPEC’s growth forecast remains the same at 2.32 mb/d in 2023.
- The IEA, OPEC, and EIA estimates for absolute world demand are now 102.02 mb/d, 101.90 mb/d, and 100.90 mb/d for 2023, respectively.
IEA and EIA OECD demand growth rises while OPEC reports a decrease.
- The IEA's assessment of y-o-y OECD demand growth rises by 20 kb/d to 0.41 mb/d, while EIA’s estimate rises by 360 kb/d to 0.09 mb/d. OPEC’s OECD demand growth falls by 120 kb/d to 0.23 mb/d.
- The IEA, OPEC and IEA non-OECD demand growth assessments rise by 50 kb/d, 130 kb/d mb/d, and 10 kb/d for a growth of 1.62 mb/d, 2.09 mb/d, and 1.39 mb/d, respectively.
- The largest divergence in OECD and non-OECD demand growth estimates are between IEA and EIA at 0.32 mb/d and between EIA and OPEC at 0.70 mb/d, respectively.
2.2 SUPPLY
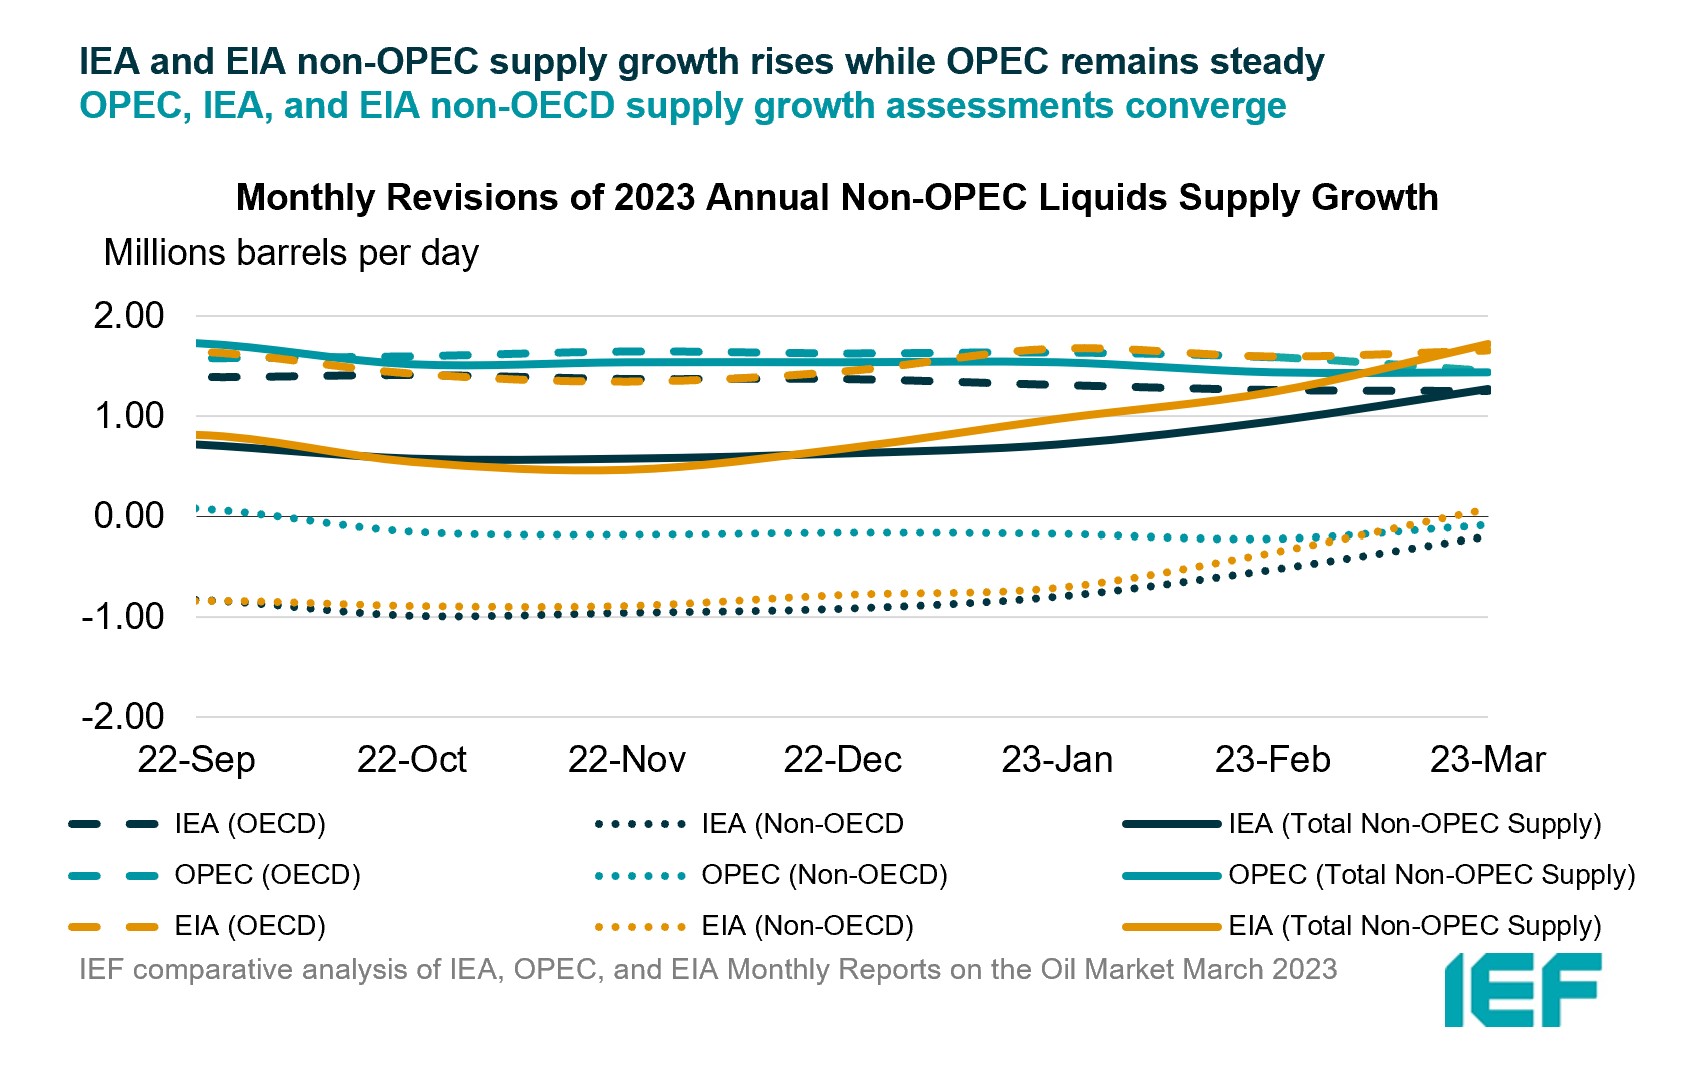
IEA and EIA non-OPEC supply growth assessments rise while OPEC remains steady.
- The IEA’s March 2023 assessment for non-OPEC supply rises by 320 kb/d to reach a growth of 1.27 mb/d while OPEC’s estimate remains the same at 1.44 mb/d. The EIA’s assessment rises by 480 kb/d for an overall growth of 1.72 mb/d. In absolute values, the IEA, OPEC, and the EIA estimate non-OPEC supply at 66.93 mb/d, 67.20 mb/d, and 67.42 mb/d, respectively for 2023.
- The IEA estimates OECD oil supply growth this year at 1.25 mb/d, OPEC pegs it at 1.45 mb/d, and EIA reports growth at 1.66 mb/d, a decrease of 10 kb/d for IEA, a decrease of 140 kb/d for OPEC, and an increase of 60 kb/d for the EIA. In absolute terms, the IEA, OPEC, and the EIA estimate OECD oil supply at 30.62 mb/d, 32.34 mb/d, and 33.91 mb/d, respectively for 2023. The largest divergence of OECD supply growth estimates is between EIA and IEA at 410 kb/d.
IEA, OPEC, and EIA all report rises in non-OECD supply for 2023.
- The IEA’s assessment for non-OECD supply rises by 330 kb/d for a decline of 0.20 mb/d in 2023.
- OPEC’s growth rises slightly by 140 kb/d for a decline of 0.08 mb/d while the EIA revised its non-OECD growth forecast up by 430 kb/d for a growth of 0.07 mb/d.
- In absolute values, the IEA, OPEC, and EIA non-OECD supply estimates are 30.83 mb/d, 32.39 mb/d, and 33.51 mb/d, respectively for 2023 with the largest divergence in growth estimates between the IEA and EIA at 0.27 mb/d.
IEA, OPEC and EIA report increases in OPEC output in February.
- The IEA reported OPEC production rose by 70 kb/d in February to 29.17 mb/d.
- OPEC showed OPEC production rose month-on-month by 120 kb/d to 28.92 mb/d.
- EIA assessed OPEC production at 28.42 mb/d, up 150 kb/d month-on-month.
2.3 STOCKS
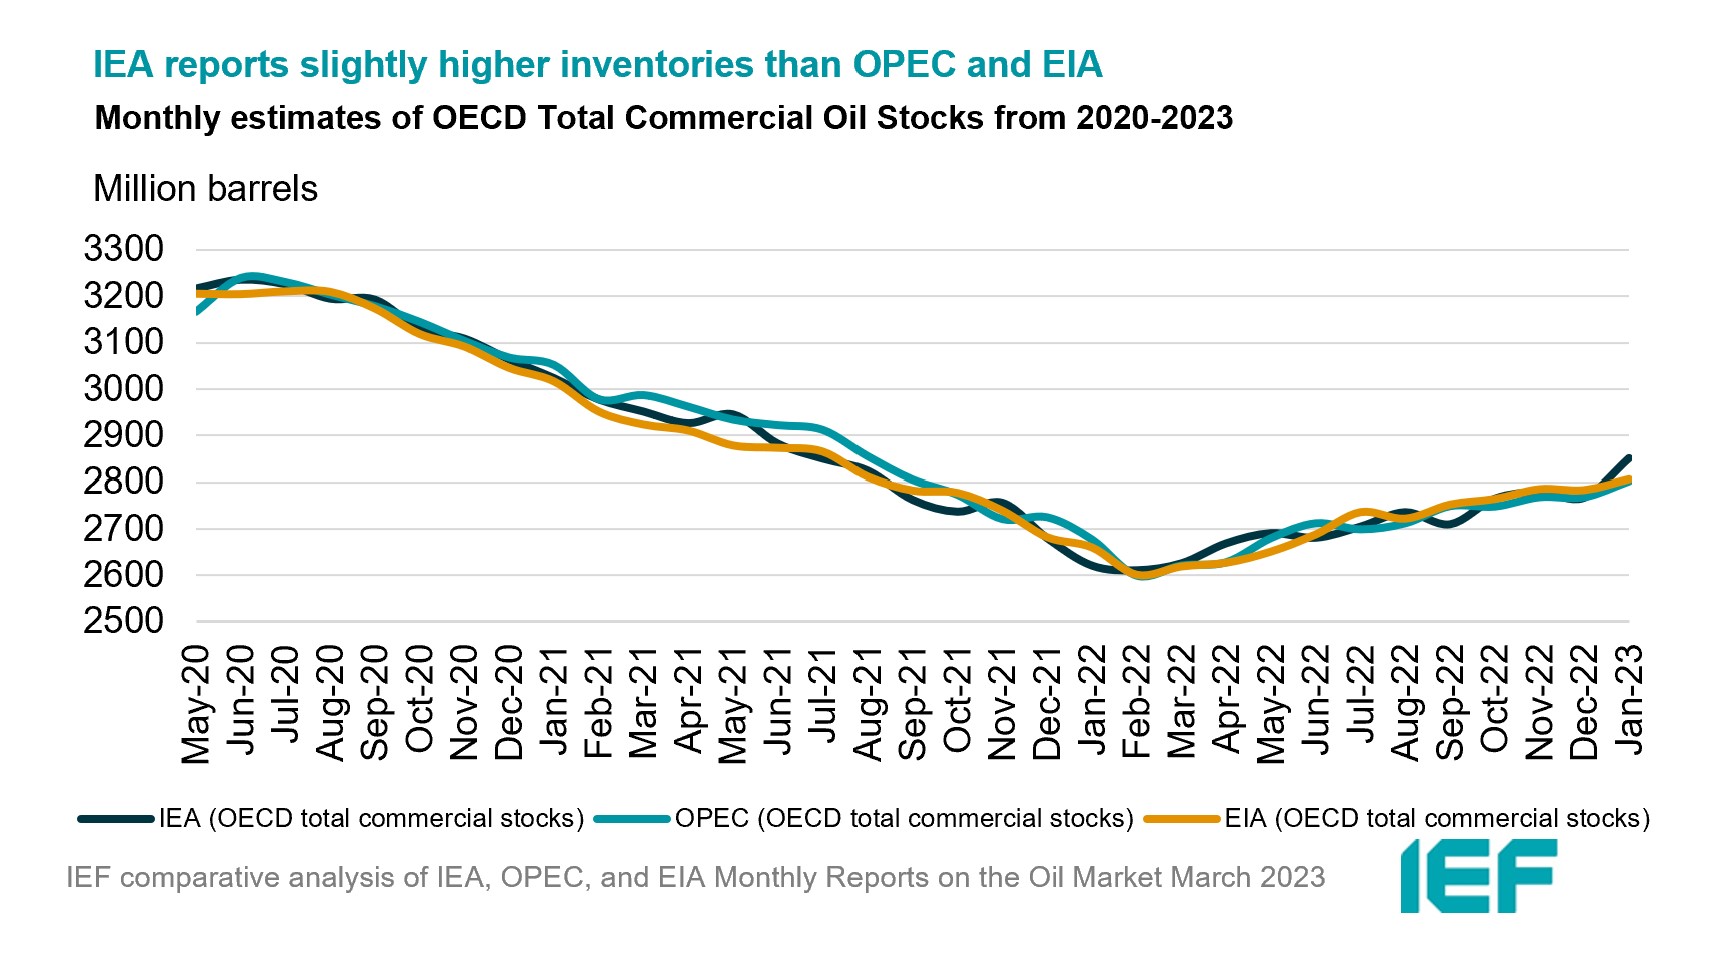
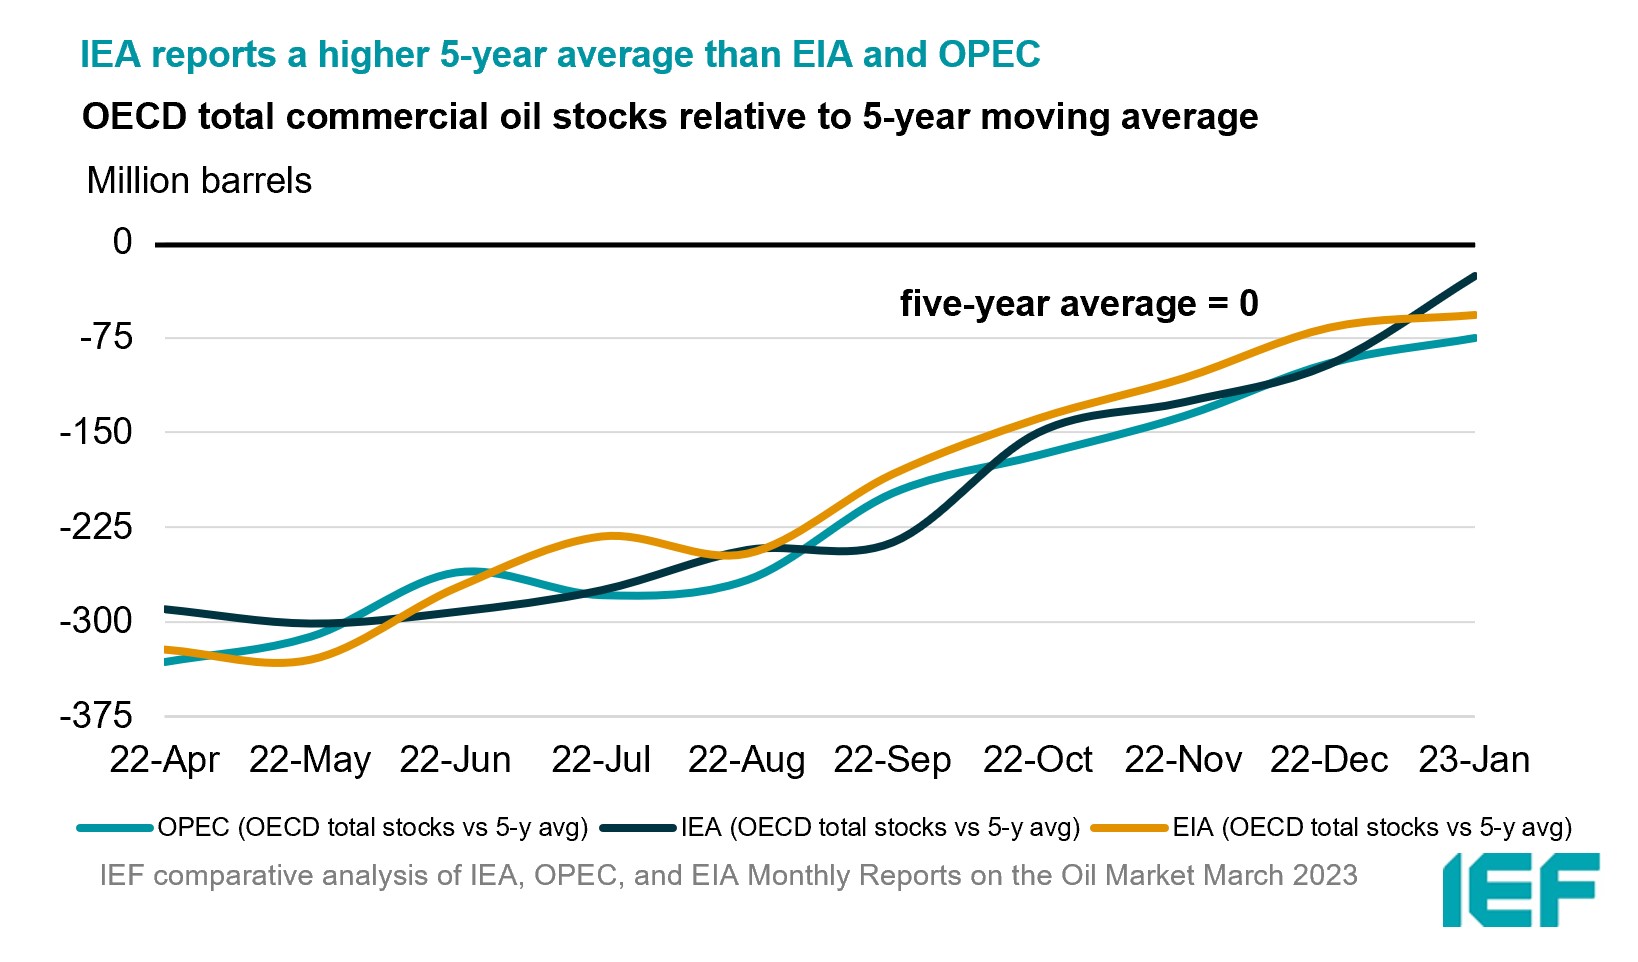
The IEA, OPEC, and EIA continue to display strong alignment on stock figures which are below the five-year average and at 60 days or more of forward cover.
- The IEA reports OECD stock levels at 2851 mb, which is close to OPEC’s assessment of 2802 mb and EIA’s assessment of 2806 mb. These are around 26 mb, 75 mb, and 57 mb below the five-year average, respectively.
- According to the IEA, crude oil inventories built by 32.2 mb while product stocks built by 24.3 mb. Other oils, including NGLs and feedstocks drew by 1.6 mb. According to OPEC, crude oil stocks built by 10.5 mb while products built by 24.5 mb.
- The widest divergence in inventories is between the IEA and OPEC at 49 mb. Total US crude inventories (excluding SPR) amount to about 479 mb, according to the EIA, which is 7 percent above the five-year average for this time of year.
2.4 SNAPSHOT (mb/d)
3. Global Analysis