")

Comparative Analysis of Monthly Reports on the Oil Market
1. International Policy and Market Context
Countries Declare Renewed Ambition on Energy, Climate, and Circular Economy Models
- As the US President-elect stated his administration's decision to rejoin the Paris Climate Agreement, and achieve net-zero emissions by 2050, new climate commitments were announced at the UK Climate Ambition Summit co-convened by the UN and France, in partnership with Italy and Chile on 12 December 2020, to mark the five-year anniversary of the Paris Climate Agreement.
- China pledged to lower its carbon dioxide emissions per unit of GDP by over 65 percent from the 2005 levels, increase the share of non-fossil fuels in primary energy consumption to around 25 percent, bring its total installed capacity of wind and solar power to over 1.2 billion kilowatts, and increase forest cover by six billion cubic meters from 2005 levels by 2030.
- The UK announced a target to reduce its greenhouse gas emissions 68 percent from 1990 levels by 2030.
- The EU also committed to reducing greenhouse gas emissions 55 percent below 1990 levels by 2030, up from the previous pledge of 40 percent.
12th OPEC and non-OPEC Ministerial Meeting Concludes
- OPEC and non-OPEC producers agreed on 3 December to increase production by 500,000 barrels per day beginning in January. This will bring the total production cuts at the start of 2021 down to 7.2 mb/d from the current levels of 7.7 mb/d. Participating countries also agreed to hold monthly OPEC and non-OPEC Ministerial meetings starting in January 2021 to assess evolving market conditions.
LNG Prices Climb To Six-Year High: Greater Energy Market Volatility Looms
- A combination of outages at major productions hubs, colder weather in key importing countries, and congestion along global shipping routes have pushed LNG spot prices in Asia to the highest level since 2014. Noting that natural gas supply will not recover as fast as demand and may cause further market turbulence over the coming months at the Gastech Conference on 8 September 2020, the IEF Report on Oil and Gas Investment in the New Risk Environment released in collaboration with the Boston Consulting Group on 10 December 2020 points at greater market volatility and higher trending prices.
Attacks on Energy Infrastructure Threaten Market Stability
- IEF Secretary General, Joseph McMonigle condemned attacks on energy infrastructure on 23 November 2020 reiterating that such attacks: "...serve as another stark reminder for governments from producing and consuming countries, as well as the global energy sector, of their responsibility to maintain energy security and market stability in evermore complex and densely interconnected world markets." A subsequent attack on 14 December on an oil tanker, as it unloaded fuel at Jeddah port, caused an explosion and a fire onboard.
2. Key Points
2.1 Demand
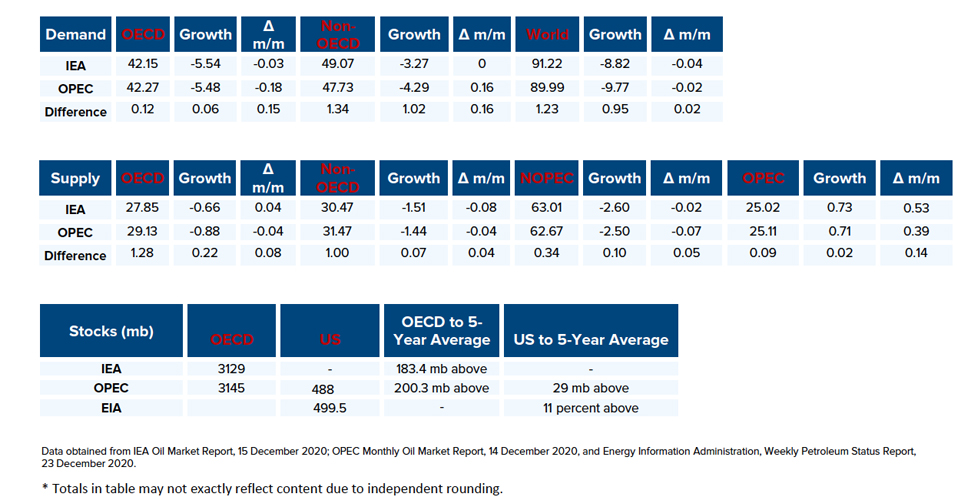
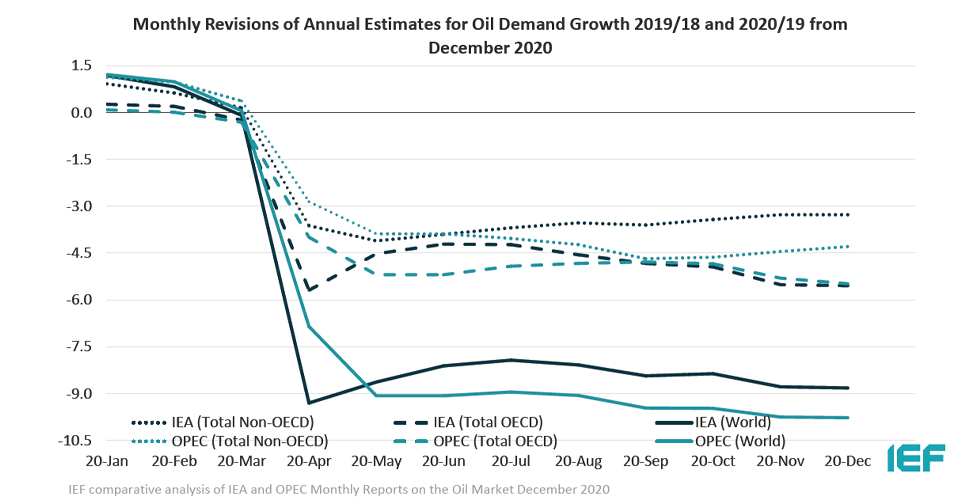
The IEA and OPEC posted small demand declines but largely remain stable.
- The IEA reported a demand decrease of 40 kb/d and a year-on-year (y-o-y) demand decline of -8.82 mb/d due to continued uncertainty caused by COVID-19 in various countries.
- OPEC's demand forecast decreased by 20 kb/d for a y-o-y demand decline of -9.77 mb/d. The IEA and OPEC estimates for absolute world demand are now 91.22 mb/d and 89.99 mb/d, respectively.
The IEA and OPEC continue to diverge on non-OECD demand.
- The IEA's non-OECD demand assessment remains unchanged for a demand decline of -3.27 mb/d, while OPEC reports an increase of 160 kb/d for an overall decline of -4.29 mb/d largely due to improving demand from China.
- The IEA's estimate for OECD demand decreased by 30 kb/d to reach a total decline of -5.54 mb/d for 2020. OPEC's estimate decreased by 180 kb/d to reach a demand decline of -5.48 mb/d.
- The IEA and OPEC differ by 60 kb/d and 1.02 mb/d on OECD and non-OECD demand declines, respectively.
2.2 Supply
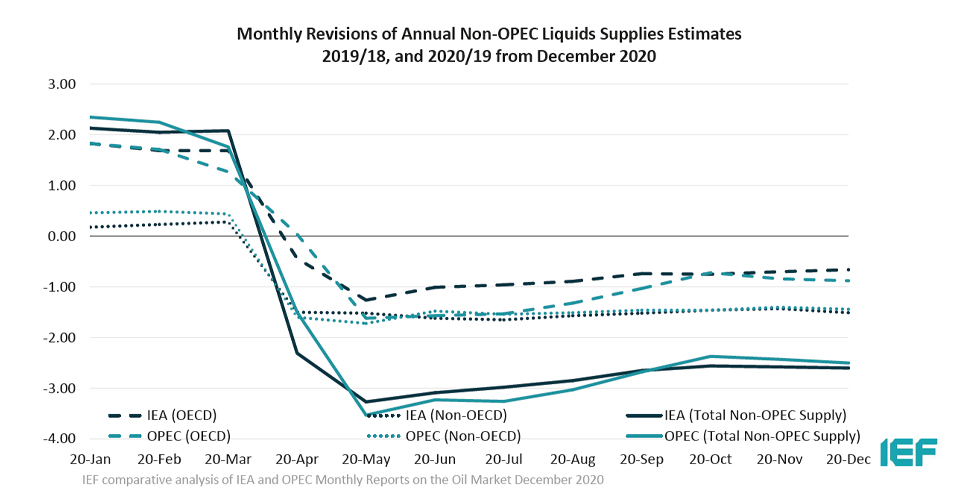
Both the IEA and OPEC's non-OPEC supply projections decrease slightly but largely remain stable.
- The IEA's December assessment for non-OPEC supply is down by 20 kb/d to reach a total decline of -2.60 mb/d while OPEC's assessment decreased by 70 kb/d for a total decline of -2.50 mb/d. In absolute values, the IEA and OPEC estimate non-OPEC supply at 63.01 mb/d and 62.67 mb/d respectively for 2020.
- The IEA reports OECD supply declines at -0.66 mb/d, up by 40 kb/d. OPEC records OECD declines at -0.88 mb/d, a decrease of 40 kb/d from last month. In absolute values, the IEA and OPEC estimate OECD supply at 27.85 mb/d and 29.13 mb/d, respectively for 2020 diverging by 1.28 mb/d.
Both the IEA and OPEC post slight decreases to non-OECD supply.
- The IEA's supply assessment decreased by 80 kb/d for a total decline of -1.51 mb/d while OPEC's forecast decreased by 40 kb/d for a total decline of -1.44 mb/d. In absolute values, the IEA and OPEC non-OECD supply estimates are 30.47 mb/d and 31.47 mb/d respectively for 2020 diverging by 1 mb/d.
Both the IEA and OPEC report increases in OPEC production in November with increases coming primarily from Libya and the UAE.
- The IEA revised its OPEC production by 730 kb/d month-on-month (m-o-m) in November to reach total production of 25.02 mb/d. OPEC also reported an increase by 710 kb/d m-o-m for total production of 25.11 mb/d in November.
2.3 Stocks
The IEA and OPEC continue to report strong alignment on stock figures. The IEA reports OECD stock levels at 3129 mb, which is close to OPEC's assessment of 3145 mb for OECD stock that is 183 mb and 200 mb above the five-year average, respectively. The divergence between OPEC and the IEA stands at 16 mb. Total US crude inventories (excluding SPR) amount to about 500 mb according to the US Energy Information Administration (EIA) which are about 11 percent above the five-year average for this time of year. OPEC reports US commercial crude stocks at about 488 mb and 29 mb above the five-year average.
2.4 Snapshot (mb/d)
3. Global Analysis
3.1 Demand Data
Figure 1
IEA and OPEC demand remains largely steady
OPEC Non-OECD demand increases slightly
Absolute Demand
- The IEA's estimate for global demand declined to -8.82 mb/d in December, a decrease of 40 kb/d, for an absolute demand of 91.22 mb/d in 2020. OECD demand decreased by a further 30 kb/d due to a rebound in COVID-19 cases across Europe and North America.
- As the traditional driver of demand growth, demand in non-OECD Asia increased for the second consecutive month from -1.33 mb/d to -1.25 mb/d according to the IEA.
- OPEC's global demand assessment decreased by 20 kb/d for a total decline of -9.77 mb/d in 2020 with absolute demand at 89.99 mb/d.
- Global demand is expected to recover by 5.69 mb/d and 5.90 mb/d in 2021 according to the IEA and OPEC, respectively.
OECD Demand
- The IEA reports an OECD oil demand decline of -5.54 mb/d, down from last month's figure of -5.51 mb/d with the Americas comprising most of the decrease at -3.03 mb/d. The IEA anticipates total OECD consumption for 2020 at 42.15 mb/d.
- OPEC's demand projection for the OECD region decreased by 180 kb/d to reach a demand decline of -5.48 mb/d with the Americas comprising most of the decrease at -2.80 mb/d for an absolute 2020 demand at 42.27 mb/d.
Non-OECD Demand
- The IEA and OPEC anticipate declines in non-OECD demand for this year of -3.27 mb/d and -4.29 mb/d, respectively, diverging by 1.02 mb/d. This is driven largely by Asia, Middle East, and the Americas. Total non-OECD demand forecasts average 49.07 mb/d and 47.73 mb/d, respectively, diverging by 1.34 mb/d.
China Demand
- Overall demand in 2020 will be 13.83 mb/d, an increase of 120 kb/d from last year and demand is expected to rise by 840 kb/d in 2021 according to the IEA.
- Overall demand in 2020 will be 12.53 mb/d, a drop of 770 kb/d, but demand is expected to recover by 1.10 mb/d in 2021 according to OPEC.
India Demand
- According to the IEA, Indian demand is expected to drop by 440 kb/d in 2020 to reach a total demand of 4.67 mb/d with a recovery by 390 kb/d in 2021.
- Overall demand will decline by 800 kb/d with total demand of 4.04 mb/d in 2020. Demand will recover by 570 kb/d in 2021 according to OPEC.
3.2 Supply Data
Figure 2
IEA and OPEC Non-OPEC supply estimates decrease slightly
IEA and OPEC OECD estimates diverge slightly
Non-OPEC Supply
- The IEA forecasts non-OPEC supply at 63.01 mb/d with an adjusted supply drop of -2.60 mb/d for 2020, a decrease of 20 kb/d compared to last month. In 2021, non-OPEC production will see a modest recovery of 540 kb/d.
- OPEC's December assessment of total non-OPEC supply for 2020 stands at 62.67 mb/d. Supply decreased by 70 kb/d with a total decline of -2.50 mb/d. Most of the decline comes from Russia (-1.05 mb/d), the US (-0.77 mb/d), and Canada (-0.30 mb/d). Norway, Brazil, and China are forecast to be the key drivers of growth.
OECD Supply
- The IEA forecasts OECD supplies to decline by -0.66 mb/d for 2020 while OPEC reports a decline at -0.88 mb/d with total supply reaching 27.85 mb/d and 29.13 mb/d respectively in 2020 and diverging by 1.28 mb/d.
- The IEA's data shows that OECD Americas oil supply declines by 0.87 mb/d to reach 23.78 mb/d in total. OPEC reports a decline of -1.07 mb/d with total oil supply reaching 24.70 mb/d in 2020.
- The IEA's assessment for OECD Europe supply records an increase by 200 kb/d for total production of 3.53 mb/d led primarily by Norway. OPEC's assessment for total OECD Europe production in 2020 is 3.89 mb/d with a growth of 180 kb/d.
OPEC Supply
- The IEA reports that OPEC production increased by 730 kb/d m-o-m in November to reach total production of 25.02 mb/d led by Libya and the UAE.
- OPEC reports that total OPEC-13 crude oil production averaged 25.11 mb/d in November according to secondary sources which is an increase of 710 kb/d m-o-m. Crude oil output increased primarily in Libya and the UAE.
3.3 Stock Data
- IEA data shows OECD commercial inventories fell by 55.3 mb m-o-m in October to 3129 mb and are 183.4 mb above the five-year average. Crude inventories dropped by only 2.5 mb while product stocks fell by 44.1 mb. Other oils, including NGLs and feedstocks drew by 8.7 mb.
- According to OPEC, preliminary data for October showed that total OECD commercial oil fell by 46.3 mb m-o-m to 3145 mb and are now 200.3 mb above the latest five-year average. Unlike the IEA, OPEC estimates a sizable crude draw of 21.5 mb while product stocks fell an additional 24.8 mb.
- OECD Asia Oceania crude stocks increased by 5.1 mb according to the IEA while OPEC records a decrease of 0.3 mb for the OECD Asia Pacific. OECD Europe stocks fell by 0.4 mb according to the IEA and 8.3 mb according to OPEC.
JODI Data:
- US crude oil closing stock levels fell by 14.75 mb m-o-m in October to 1124.8 mb.
- Japanese crude oil stock levels in October were revised downward by 5.84 mb and its October figure rose month-on-month by 6.81 mb m-o-m to 384.21 mb.
- Korean crude oil closing stock levels rose by 4.71 mb m-o-m in October to a 33 month high of 131.46 mb.
- German crude oil closing stock levels in October were revised upward by 1.39 mb to 154.07 mb.
- UK crude oil closing stock levels fell by 3.55 mb m-o-m in October to 24.11 mb – the lowest level since monitoring began in 2002.
While both the IEA and OPEC report closely aligned data on OECD stocks due to a continuous and reliable data stream and data harmonisation efforts, comprehensive data on stock developments for non-OECD countries is still work in progress as large differences in assessments show.
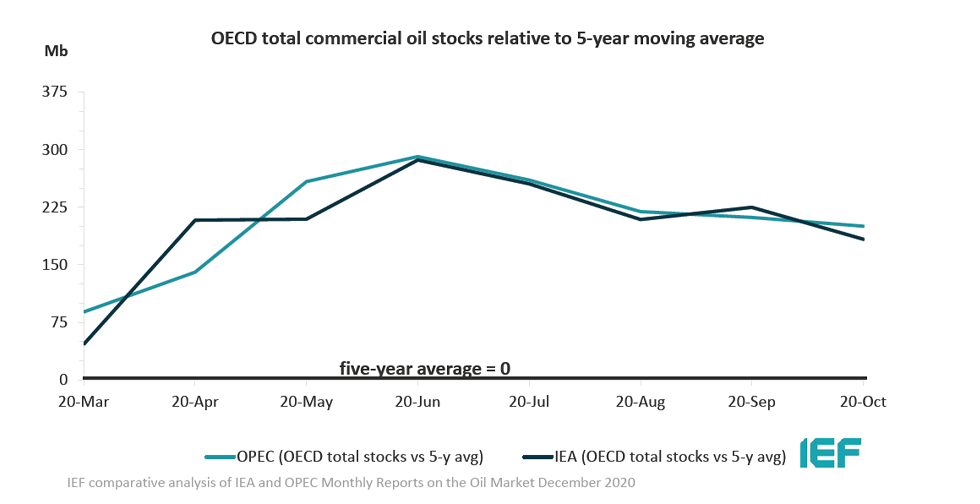
Figure 3
IEA and OPEC data show alignment on OECD stock builds
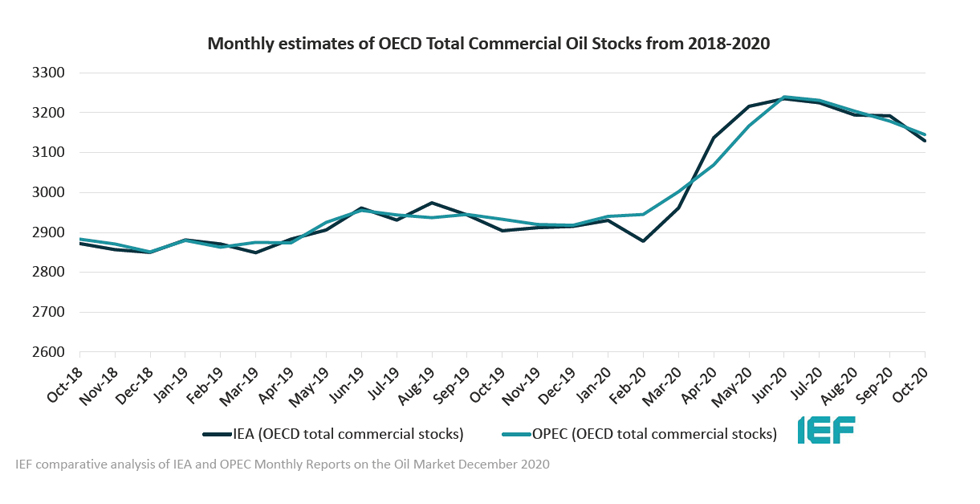
Figure 4
Stock decline rates by the IEA and OPEC converge
OECD stocks remain well above five-year average
3.3.1 Global Stock Analysis
IEA, JODI, and available weekly inventory data imply crude, NGL, and product stocks fell for a third consecutive month in October, removing ~65.7 mb from the still-glutted inventories.
- Floating crude inventories declined by 3.5 mb in October and 18.1 mb in November. They now stand ~95 mb below their summer peak but remain >60 mb above their five-year average. Nearly 75% of the remaining glut is located off shore Asia.
- Rapidan Energy Group's preliminary global inventory estimate for November shows visible inventories tumbled by 58 mb, led by a 26.1 mb decline in OECD product stocks. Non-OECD product inventories drew by an additional 13.6 mb.
- Global inventories drew by ~98.5 mb in 3Q20, led by a ~71.4 mb drop in floating crude. Steep draws in OECD inventories and floating crude stocks were partially offset by a ~25.3 mb build in non-OECD product and other inventories. Notably, JODI non-OECD crude and product inventory data for July and August continue to show a net 31.3 mb build in Indonesia and a 26.8 mb build in China.
- IEA and OPEC's 1H20 global oil balances continue to imply the market was oversupplied by ~1.3-1.5 billion barrels. Preliminary data through November show inventories have drawn by ~222 mb in 2H20, reversing only ~15% of the builds implied by the agencies.
Table 1
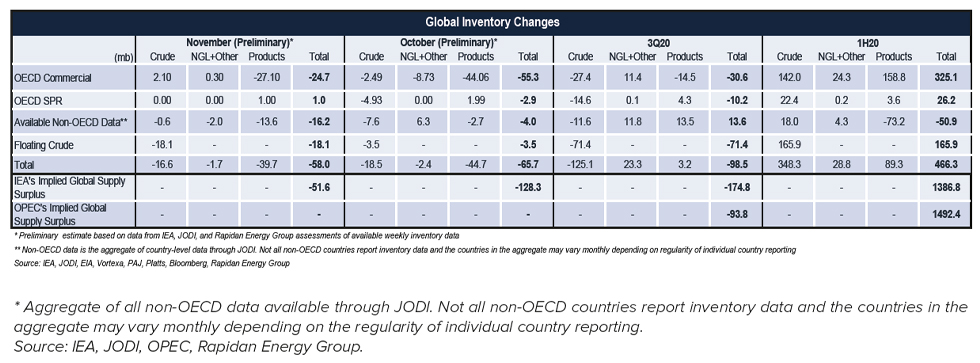
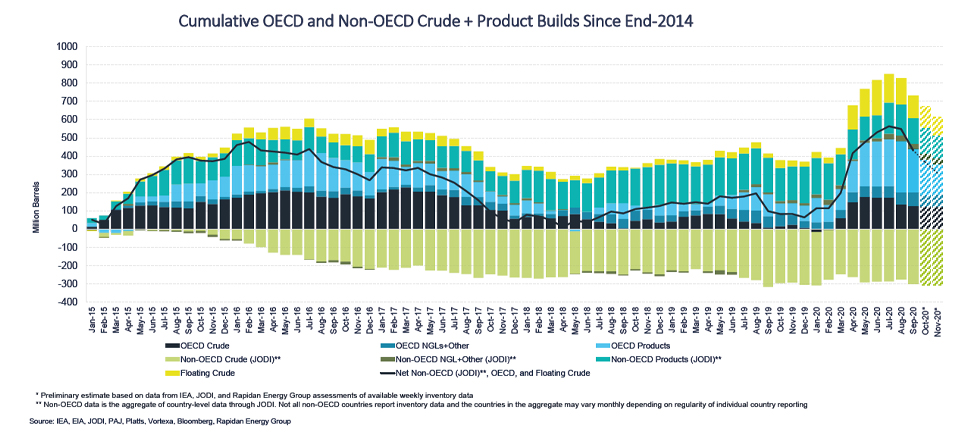
Figure 5
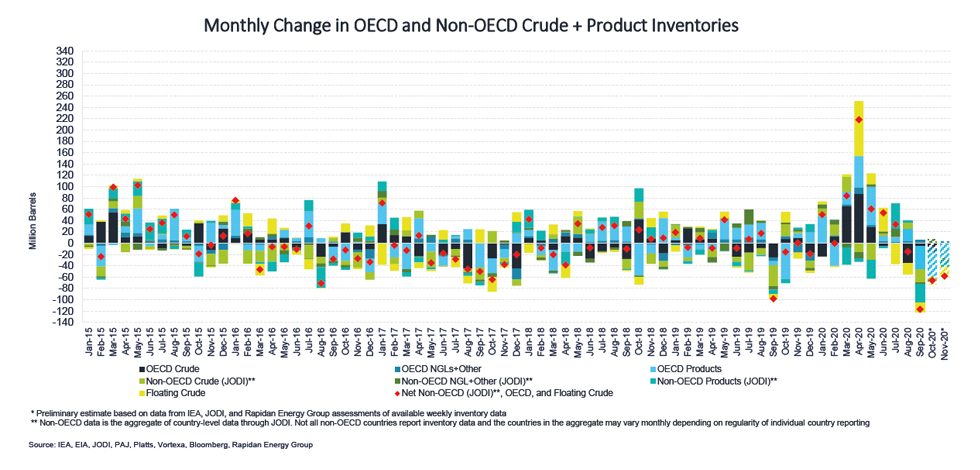
Figure 6
Explanatory Note
The IEF conducts a comprehensive comparative analysis of the short-, medium-, and long-term energy outlooks of the IEA and OPEC, to inform the IEA-IEF-OPEC Symposium on Energy Outlooks that the IEF hosts in Riyadh as part of the trilateral work programme on a yearly basis.
To inform IEF stakeholders on how perspectives on the oil market of both organisations evolve over time more regularly, this monthly summary provides:
- An overview of key events and initiatives in the international policy and market context.
- Key findings and a snapshot overview of data points gained from comparing basic historical data and short-term forecasts of the IEA Oil Market Report and the OPEC Monthly Oil Market Report.
- A comparative analysis of oil inventory data reported by JODI, the IEA, OPEC, the US EIA and secondary sources in collaboration with the Rapidan Energy Group.
The International Energy Forum
The IEF is the neutral facilitator of informal, open, informed and continuing global energy dialogue. Covering all six continents, the IEF is unique in that it comprises not only countries of the IEA and OPEC, but also key players including China, India, Russia and South Africa. The Forum's biennial Ministerial Meetings are the world's largest gathering of Energy Ministers. Through the Forum and its associated events, IEF Ministers, their officials, energy industry executives, and other experts engage in a dialogue of increasing importance to global energy security and orderly energy transitions. The IEF and the global energy dialogue are promoted by a permanent Secretariat of international staff based in the Diplomatic Quarter of Riyadh, Saudi Arabia. For more information visit www.ief.org.