")

Comparative Analysis of Monthly Reports on the Oil Market
1. International Policy and Market Context
OPEC and Non-OPEC Partners Increase Production
- OPEC production increased by 1.2 mb/d and 0.98 mb/d in July according to IEA and OPEC reports after Kuwait, Oman, Saudi Arabia, and the UAE ended additional voluntary adjustments. The OPEC + agreement has now transitioned to Phase 2 in August, when the adjustments pledged by the OPEC+ alliance ease from 9.7 mb/d to 7.7 mb/d through December.
Jet Fuel Demand Weaker Than Anticipated
- The IEA lowered its overall oil demand forecast after three months of consecutive increases to 8.1 mb/d largely due to reduced air travel. Jet fuel demand will decrease by 39 percent or 3.1 million b/d this year as the recovery has been "weaker than anticipated with flight schedules still well below normal levels in many regions." In 2021, the year-on-year (y-o-y) recovery for jet fuel is anticipated to be just below 1 mb/d.
Oil Inventory Data
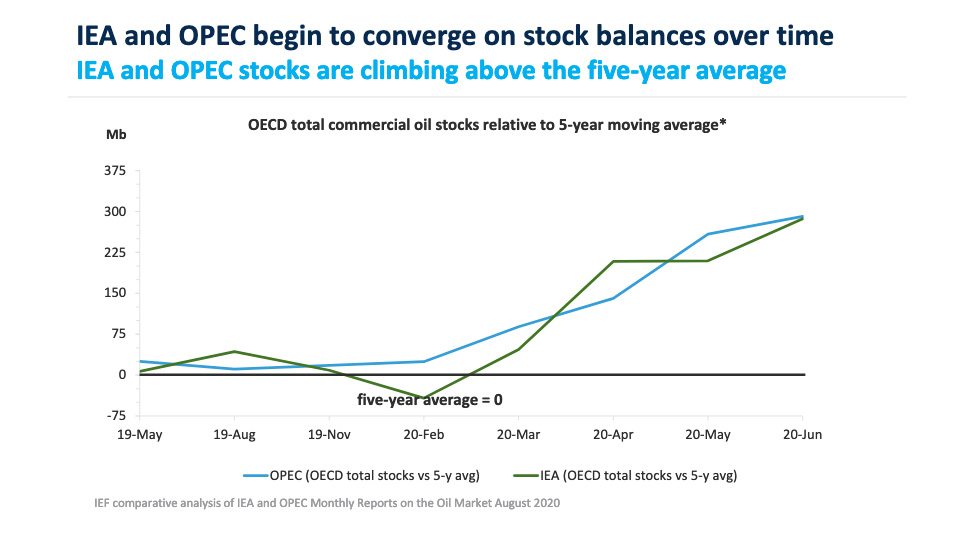
- IEA estimates June OECD commercial inventories rose by 16.2 mb month-on-month (m-o-m) to 3,235 mb and stood 286.7 mb above the five-year average. According to OPEC, preliminary data for June showed that total OECD commercial oil stocks rose by 24.3 mb m-o-m to 3240 mb and are now 291.2 mb above the latest five-year average.
US Rig Count Falls To Lowest Level Since 2005
- US shale oil production continues to be impacted due to decreased oil demand amidst the COVID-19 pandemic. The number of active oil rigs in U.S. fields fell by 4 to 172, according to Baker Hughes – the lowest level of activity since 2005 before the shale boom started. The IEA and OPEC expect US production to decrease by 910 kb/d and 1.32 mb/d in 2020, respectively.
2. Key Points
2.1 Demand
- Both the IEA and OPEC report demand decreases in August.
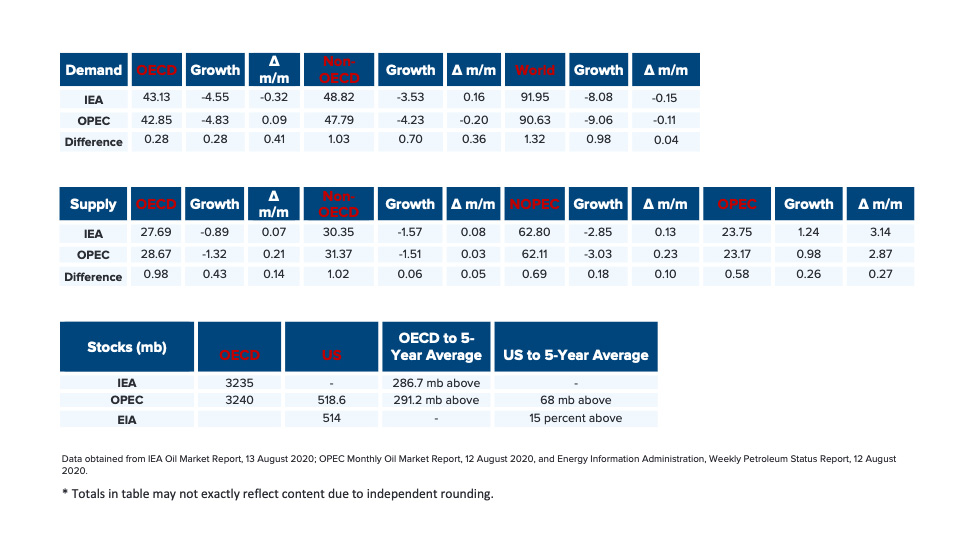
- The IEA reported a demand decrease for the first time in three months by 150 kb/d to reach a y-o-y demand decline of -8.08 mb/d.
- OPEC's demand forecast decreased by 110 kb/d for a y-o-y demand decline of 9.06 mb/d. The IEA and OPEC estimates for absolute world demand are now 91.95 mb/d and 90.63 mb/d, respectively.
- The IEA and OPEC converge closer on OECD demand decline while diverging on non-OECD demand.
- The IEA's estimate for OECD demand decreases by 320 kb/d to reach a total decline of –4.55 mb/d for 2020. OPEC's estimate increases by 90 kb/d to reach a demand decline of -4.83 mb/d.
- The IEA's non-OECD demand assessment increased by 160 kb/d for a total demand decline of –3.53 mb/d, while OPEC reports a decrease of 200 kb/d for an overall decline of -4.23 mb/d.
- The IEA and OPEC differ by 0.28 kb/d and 0.70 kb/d on OECD and non-OECD demand decline, respectively.
2.2 Supply
- Both the IEA and OPEC's overall supply projections move up in August.
- The IEA's August assessment for non-OPEC supply is up by 130 kb/d to reach a total decline of -2.85 mb/d while OPEC's assessment increases by 230 kb/d for a total decline of -3.03 mb/d. In absolute values, the IEA and OPEC estimate non-OPEC supply at 62.80 mb/d and 62.11 mb/d respectively for 2020.
- The IEA reports OECD supply decline at -0.89 mb/d, up by 70 kb/d. OPEC records OECD decline at -1.32 mb/d, an increase of 210 kb/d from last month. In absolute values, the IEA and OPEC estimate OECD supply estimates at 27.69 mb/d and 28.67 mb/d, respectively.
- Both the IEA and OPEC post increases to non-OECD supply in August.
- The IEA's supply assessment increased by 80 kb/d for a total decline of -1.57 mb/d while OPEC revised its assessment up by 30 kb/d to reach -1.51 mb/d.
- In absolute values, the IEA and OPEC non-OECD supply estimates are 30.35 mb/d and 31.37 mb/d respectively for 2020.
- Both the IEA and OPEC report increases in OPEC production as Kuwait, Oman, Saudi Arabia, and the United Arab Emirates ended their voluntary production adjustments.
- The IEA revised its OPEC production by 1.24 mb/d m-o-m in July to reach total production of 23.75 mb/d.
- OPEC also reported an increase by 0.98 mb/d m-o-m for total production of 23.17 mb/d in July.
2.3 Stocks
- The IEA and OPEC continue to report strong alignment on stock figures. The IEA reports OECD stock levels at 3235 mb, which is close to OPEC's assessment of 3240 mb for OECD stock that is 286.7 mb and 291.2 mb above the five-year average, respectively. The divergence between OPEC and the IEA stands at 5 mb for August. Total US crude inventories (excluding SPR) amount to about 514 mb according to the US Energy Information Administration (EIA). The EIA reports U.S. crude oil inventories are 15 percent above the five-year average for this time of year. OPEC reports US commercial crude stocks at about 519 mb that are above the five-year average by about 68 mb.
2.4 Snapshot (mb/d)
3. Global Analysis
3.1 Demand Data
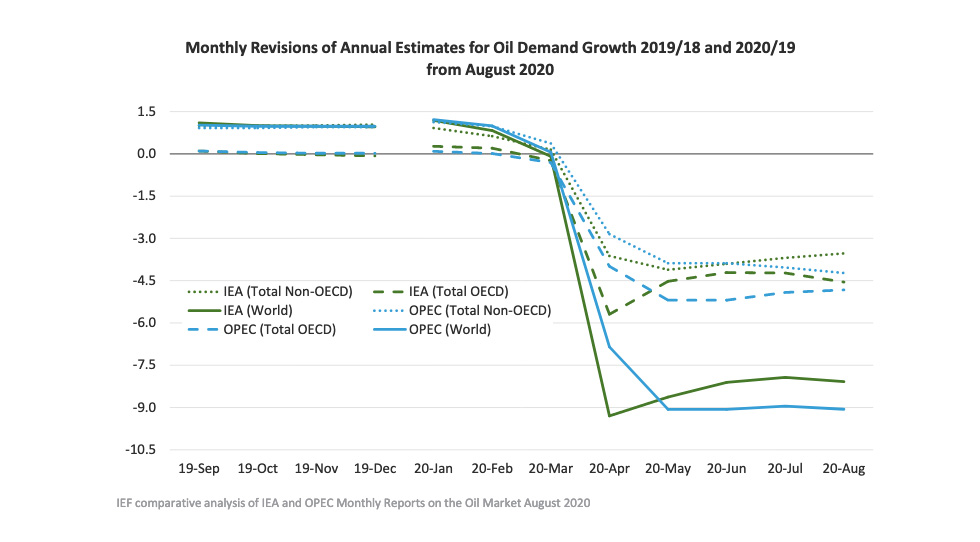
See the graph below for the monthly revisions of IEA and OPEC annual estimates for 2019 and newestimates for 2020 demand.
*monthly estimates rounded to the nearest barrel.
Both IEA and OPEC report slight decreases in demand in August
IEA and OPEC disagree on Non-OECD demand
- Absolute Demand
- The IEA's estimate for global demand declined to -8.08 mb/d in August for an absolute demand of 91.95 mb/d in 2020. This reverses three consecutive months of demand recovery since April.
- As the traditional driver of demand growth, non-OECD Asia demand has been revised up from -1.64 mb/d to -1.54 mb/d in August according to the IEA.
- OPEC's global demand increased slightly for a total decline of -9.06 mb/d in 2020. Absolute demand is below the 100 mb/d mark at 90.63 mb/d.
- Global demand is expected to recover by 5.19 mb/d and 7 mb/d in 2021 according to the IEA and OPEC, respectively.
- OECD Demand
- The IEA reports OECD oil demand decline at -4.55 mb/d, down slightly from last month's figure of -4.23 mb/d with the Americas comprising most of the decrease at -2.44 mb/d. The IEA anticipates total OECD consumption for 2020 at 43.13 mb/d.
- OPEC's demand projection for the OECD region increases by 90 kb/d to reach a demand decline of -4.83 mb/d with total OECD demand for 2020 at 42.85 mb/d.
- Non-OECD Demand
- The IEA and OPEC anticipate declines in non-OECD demand for this year at -3.53 mb/d and -4.23 mb/d, respectively. This is driven largely by Asia, Middle East, and the Americas. Total non-OECD demand forecasts average 48.82 mb/d and 47.79 mb/d, respectively.
- China Demand
- Overall demand in 2020 will be 13.59 mb/d, a decrease of 110 kb/d from last year but is expected to rise by 720 kb/d in 2021 according to the IEA.
- Overall demand in 2020 will be 12.43 mb/d, a drop of 0.87 mb/d, but is expected to recover by 1.10 mb/d in 2021 according to OPEC.
- India Demand
- According to the IEA, Indian demand is expected to drop by 450 kb/d in 2020 to reach total demand of 4.66 mb/d with a recovery by 410 kb/d in 2021.
- Overall demand will decline by 600 kb/d in 2020 for total demand of 4.24 mb/d and recover by 740 kb/d in 2021 according to OPEC.
3.2 Supply Data
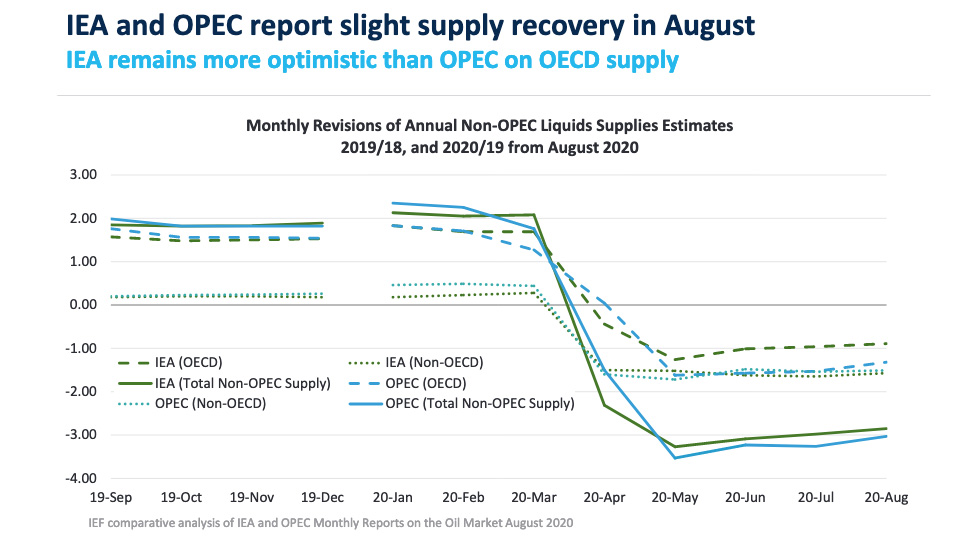
See the graph below for the monthly revisions of IEA and OPEC annual estimates for 2019 and newestimates for 2020 supply.
*monthly estimates rounded to the nearest barrel.
IEA and OPEC report slight supply recovery in August
IEA remains more optimistic than OPEC on OECD supply
- Non-OPEC Supply
- The IEA forecasts non-OPEC supply at 62.80 mb/d with a supply decline of -2.85 mb/d for 2020, an increase of 130 kb/d compared to last month. In 2021, non-OPEC production will see a modest demand recovery of 550 mb/d. Output from non-OPEC countries outside the OPEC+ group is set to fall by 1.5 mb/d on average, accounting for more than half the forecast non-OPEC output drop of 2.85 mb/d.
- OPEC's August assessment of total non-OPEC supply for 2020 stands at 62.11 mb/d. Supply growth increases by 230 kb/d with a total decline of -3.03 mb/d. Most of the decrease comes from the US (-1.32 mb/d), Russia (-1.13 mb/d), and Canada (-0.30 mb/d). Norway, Brazil, and Guyana are forecast to be the key drivers of growth.
- OECD Supply
- The IEA forecasts OECD supply decline at -0.89 mb/d for 2020 while OPEC reports a slightly larger decline at -1.32 mb/d with total supply reaching 27.69 mb/d and 28.67 mb/d respectively in 2020.
- The IEA's data also shows OECD Americas oil supply declines by -1.13 mb/d to reach 23.25 mb/d in total. OPEC reports a larger decline at -1.63 mb/d with total oil supply reaching 23.90 mb/d in 2020.
- The IEA's assessment for OECD Europe supply records an increase by 0.22 mb/d for total production of 3.56 mb/d led primarily by Norway. OPEC's assessment for total OECD Europe production in 2020 is 3.98 mb/d with a growth of 0.27 mb/d.
- OPEC Supply
- The IEA reports that OPEC production increased by 1.24 mb/d m-o-m in July to reach total production of 23.75 mb/d as several Gulf States ended their voluntary adjustments.
- OPEC reports that total OPEC-13 crude oil production averaged 23.17 mb/d in July according to secondary sources which is an increase of 980 mb/d m-o-m. Crude oil output increased in Saudi Arabia, UAE, Kuwait, and Iraq while production decreased in Angola, Congo, and Gabon.
3.3 Stock Data
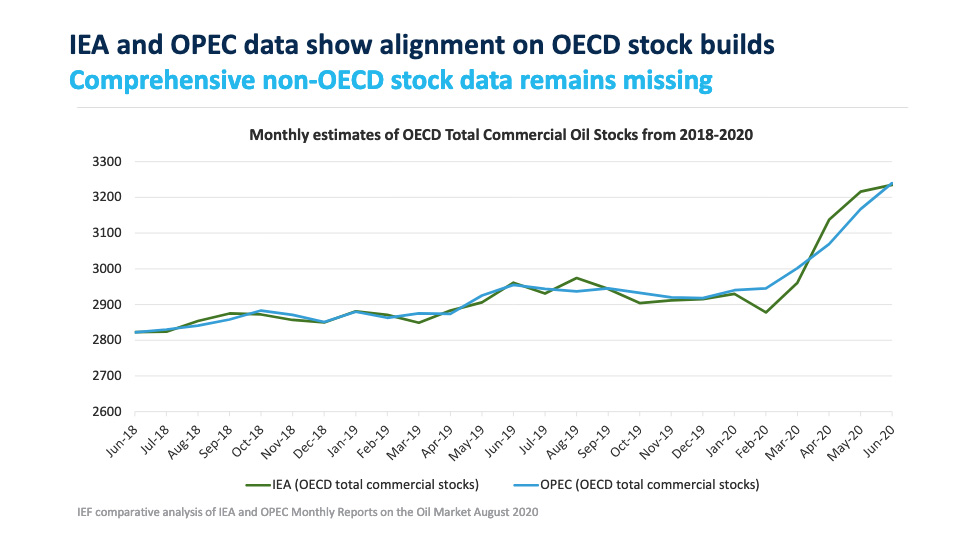
See the graphs below for monthly estimates of OECD total commercial oil stocks and the monthly comparison versus the five-year average.
*monthly estimates rounded to the nearest barrel.
- IEA data shows OECD commercial inventories rose by 16.2 mb m-o-m in June to 3235 mb and are 286.7 mb above the five-year average. Product builds (23.7 mb) more than offset the first monthly crude draw (7.5 mb) of the year according to the IEA.
- According to OPEC, preliminary data for June showed that total OECD commercial oil stocks rose by 24.3 mb m-o-m to 3240 mb and are now 291.2 mb above the latest five-year average. OPEC estimates builds in both crude (12.8 mb) and products (11.5 mb). The largest divergence between the agencies is in the OECD Americas where IEA estimates commercial crude inventories grew by 2.8 mb in June and OPEC estimates an 18.2 mb increase.
- According to JODI Data:
- US crude oil closing stocks in April was revised downward by 3060 kb and its May figure rose again m-o-m by 16.54 mb to 1183 mb.
- Having hit its historical low of 370.01 mb in January, Japanese crude oil closing stocks have risen by 28.35 mb to 398.44 mb in May.
- Korean crude oil closing stocks in May rose again m-o-m by 6.43 mb to 122.27 mb.
- UK crude oil closing stocks in May fell m-o-m by 2844 kb to 26.84 mb.
- While both the IEA and OPEC report closely aligned data on OECD stocks due to a continuous and reliable data stream and data harmonisation efforts, comprehensive data on stock developments for non-OECD countries is still work in progress.
IEA and OPEC data show alignment on OECD stock builds
Comprehensive non-OECD stock data remains missing
IEA and OPEC begin to converge on stock balances over time
IEA and OPEC stocks are climbing above the five-year average
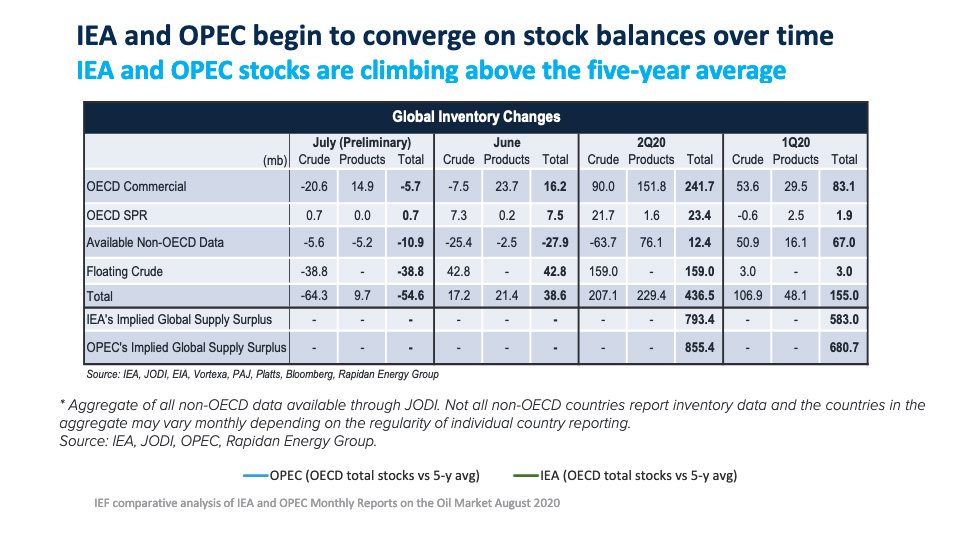
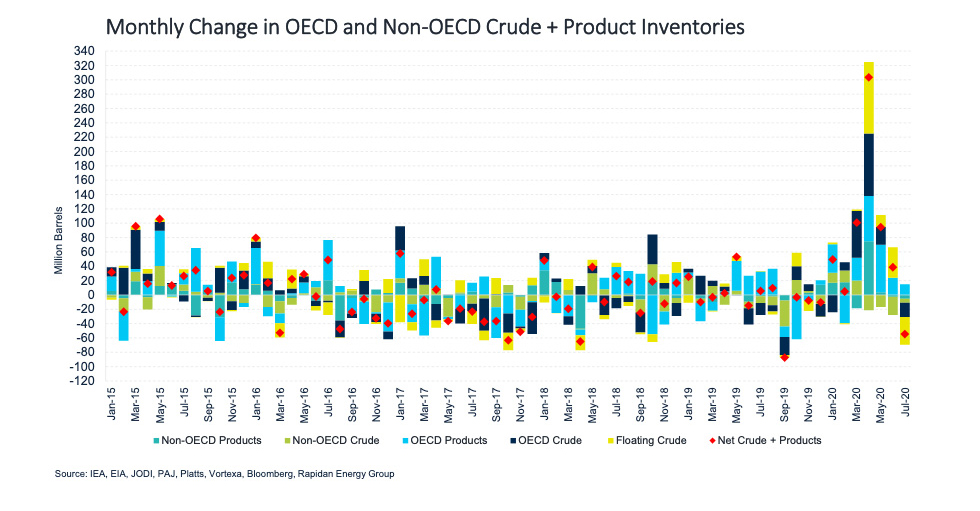
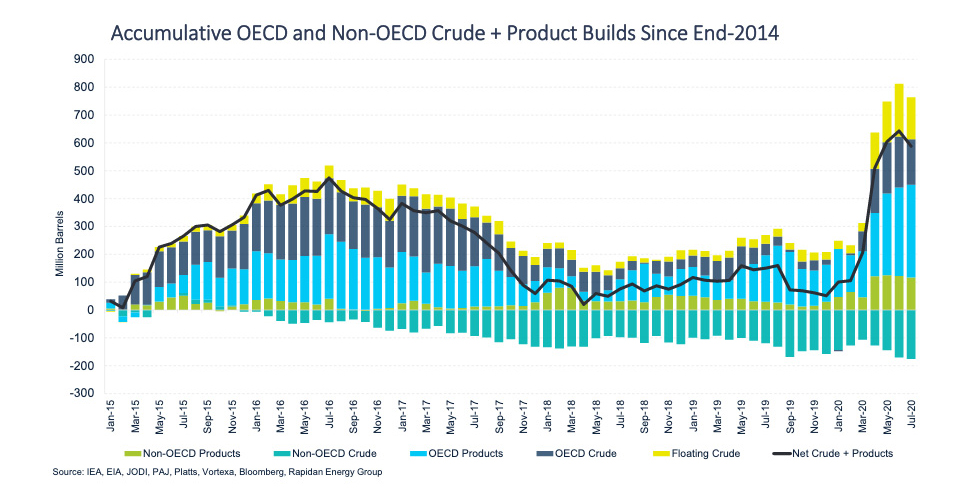
Preliminary Available Data Shows Global Inventories Drew in July Following Six Consecutive Months of Builds
- Rapidan Energy Group's preliminary global inventory estimate shows visible inventories tumbled by 54.6 mb in July led by a 38.8 mb drop in floating crude storage. Meanwhile, steep draws in OECD commercial crude stocks (20.6 mb) were partially offset by product builds (14.9 mb) across the same regions.
- IEA and OPEC's 1H20 global oil balances imply the market was oversupplied by ~1.4-1.5 billion barrels. Only ~22-25% of the oversupply appeared in OECD commercial and government inventory data. IEA's China crude balance implies another ~20% of 1H20's oversupply flowed into Chinese crude stocks. And only ~5% is accounted for in available JODI non-OECD stock data through May.
* Non-OECD data is the aggregate of country-level data through JODI. Not all non-OECD countries report inventory data and the countries in the aggregate may vary monthly depending on regularity of individual country reporting.
Explanatory Note
The IEF conducts a comprehensive comparative analysis of the short-, medium-, and long-term energy outlooks of the IEA and OPEC, to inform the IEA-IEF-OPEC Symposium on Energy Outlooks that the IEF hosts in Riyadh as part of the trilateral work programme on a yearly basis.
To inform IEF stakeholders on how perspectives on the oil market of both organisations evolve over time regularly, this monthly summary provides:
- An overview of key events and initiatives in the international policy and market context.
- Key findings and a snapshot overview of data points gained from comparing basic historical data and short-term forecasts of the IEA Oil Market Report and the OPEC Monthly Oil Market Report.
- A comparative analysis of oil inventory data reported by JODI, the IEA, OPEC, the US EIA, and secondary sources in collaboration with the Rapidan Energy Group.
The International Energy Forum
The IEF is the neutral facilitator of informal, open, informed and continuing global energy dialogue. Covering all six continents, the IEF is unique in that it comprises not only countries of the IEA and OPEC, but also key players including China, India, Mexico, Russia and South Africa. The Forum's biennial Ministerial Meetings are the world's largest gathering of Energy Ministers. Through the Forum and its associated events, IEF Ministers, their officials, energy industry executives, and other experts engage in a dialogue of increasing importance to global energy security and orderly energy transitions. The IEF and the global energy dialogue are promoted by a permanent Secretariat of international staff based in the Diplomatic Quarter of Riyadh, Saudi Arabia. For more information visit www.ief.org.