")

Comparative Analysis of Monthly Reports on the Oil Market
1. International Policy and Market Context
New U.S. President Joe Biden Rejoins Paris Climate Agreement and Signs Broad Executive Order on Climate Change
- Newly inaugurated U.S. President Joe Biden rejoins the Paris Climate Agreement which will take effect in 30 days and signed the Executive Order on Tackling the Climate Crisis at Home and Abroad. Other actions included:
- Directing the Environmental Protection Agency and Transportation Department to consider revising automobile fuel-economy and tailpipe emissions standards.
- A 60-day moratorium on issuing oil and gas leases on federal lands.
- Halting construction of the cross-border Keystone XL oil pipeline from Canada by revoking the permit awarded by the Trump administration.
Japan Suffers Worst Energy Crisis Since 2011 as Electricity Prices Soar
- Domestic wholesale electricity prices in Japan soared to record highs due to cold weather in East Asia coupled with low natural gas supply (liquified natural gas specifically) and limited output from nuclear power stations. The resulting demand for natural gas, for both electricity generation and home heating, pushed Asian spot LNG prices to their highest point since the launch of the JKM LNG Price Assessment. Other factors pushing Asian LNG prices higher were a shortage of available LNG carriers and delays transiting the Panama Canal.
Saudi Arabia Makes Voluntary Adjustment at the 13th OPEC and non-OPEC Ministerial Meeting
- The 13th OPEC and non-OPEC Ministerial Meeting on 5 January 2021 acknowledged the need to gradually return 2 mb/d to the market, with the pace being determined according to market conditions. Saudi Arabia announced a unilateral production adjustment of 1 mb/d in February and March. This will widen the overall production adjustment to 8.125 mb/d in February before narrowing to 8.05 million in March.
2. Key Points
2.1 Demand
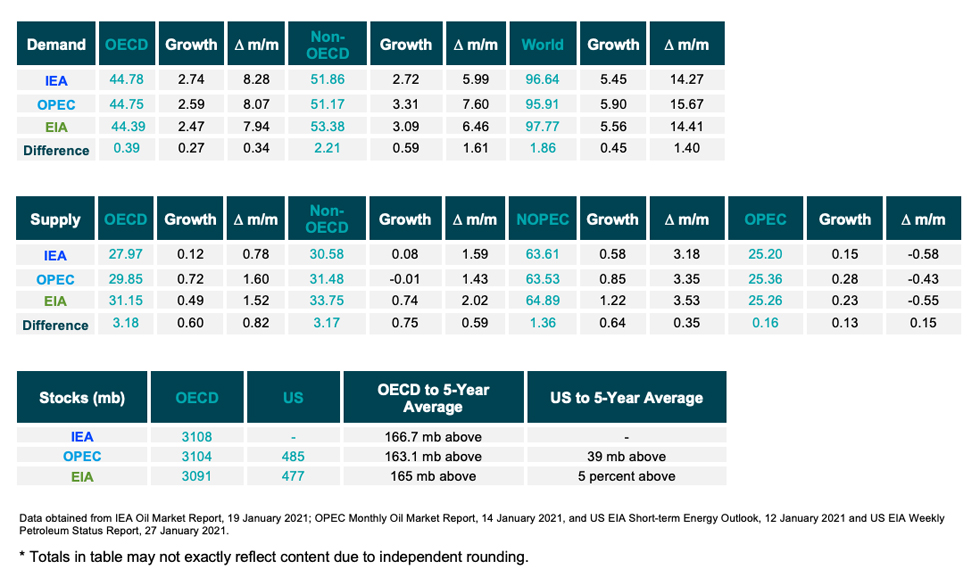
The IEA, OPEC, and EIA show alignment on demand growth in 2021.
- IEA, OPEC, and EIA production assessments for the year 2021 issued in January are new outlooks and have no bearing on the year prior.
- The IEA reports a year-on-year (y-o-y) demand growth of 5.45 mb/d due to widespread vaccine roll-out, a return of pent up demand, and the potential of economic recovery around the world.
- OPEC’s forecasts a y-o-y demand growth of 5.90 mb/d.
- EIA assessment reports demand growth of 5.56 mb/d in 2021. The IEA, OPEC, and EIA estimates for absolute world demand are now 96.64 mb/d 95.91 mb/d, and 97.77 mb/d for 2021, respectively.
The IEA, OPEC, and EIA forecast growth in OECD and non-OECD demand.
- The IEA’s non-OECD reports demand growth of 2.72 mb/d, while OPEC reports growth at 3.31 mb/d largely due to growth in Chinese demand. The EIA’s assessment for non-OECD demand growth reaches 3.09 mb/d y-o-y.
- The IEA’s estimate for OECD demand reaches a y-o-y increase of 2.74 mb/d for 2021. OPEC reports demand growth at 2.59 mb/d while EIA’s assessment sees growth at 2.47 mb/d y-o-y.
- IEA, OPEC, and EIA assessments differ by 270 kb/d and 590 kb/d on OECD and non-OECD demand growth, respectively.
2.2 Supply
The IEA, OPEC, and EIA forecast higher non-OPEC supply growth in 2021.
- The IEA’s January assessment for non-OPEC supply reaches total growth of 0.58 mb/d while OPEC reports total growth of 0.85 mb/d. The EIA reports higher overall demand growth of 1.22 mb/d y-o-y. In absolute values, the IEA, OPEC, and EIA estimate non-OPEC supply at 63.61 mb/d and 63.53 mb/d, and 64.89 mb/d, respectively for 2021.
- The IEA reports OECD supply growth at 120 kb/d while OPEC records OECD growth at 720 kb/d. The EIA also records an increase with a growth of 490 kb/d. In absolute values, the IEA and OPEC, and EIA estimate OECD supply at 27.97 mb/d, 29.85 mb/d, and 31.15 mb/d, respectively for 2021 and diverging by 3.18 mb/d.
The IEA and OPEC report less non-OECD supply growth than the EIA.
- The IEA’s supply assessment reaches total supply growth of 80 kb/d while OPEC’s forecast reports a decline of 10 kb/d. The EIA is more optimistic with a growth of 740 kb/d. In absolute values, the IEA, OPEC, and EIA non-OECD supply estimates are 30.58 mb/d and 31.48 mb/d, and 33.75 mb/d, respectively for 2021 diverging by 3.17 mb/d.
The IEA, OPEC, and the EIA report increases in OPEC production in December with increases coming primarily from Libya, Iraq, and the UAE according to the IEA and OPEC.
- The IEA revised its OPEC production by 150 kb/d month-on-month (m-o-m) in December to reach total production of 25.20 mb/d. OPEC also reported an increase by 280 kb/d m-o-m for total production of 25.36 mb/d in December. The EIA also increased its assessment by 230 kb/d for total OPEC crude production of 25.26 mb/d in December.
2.3 Stocks
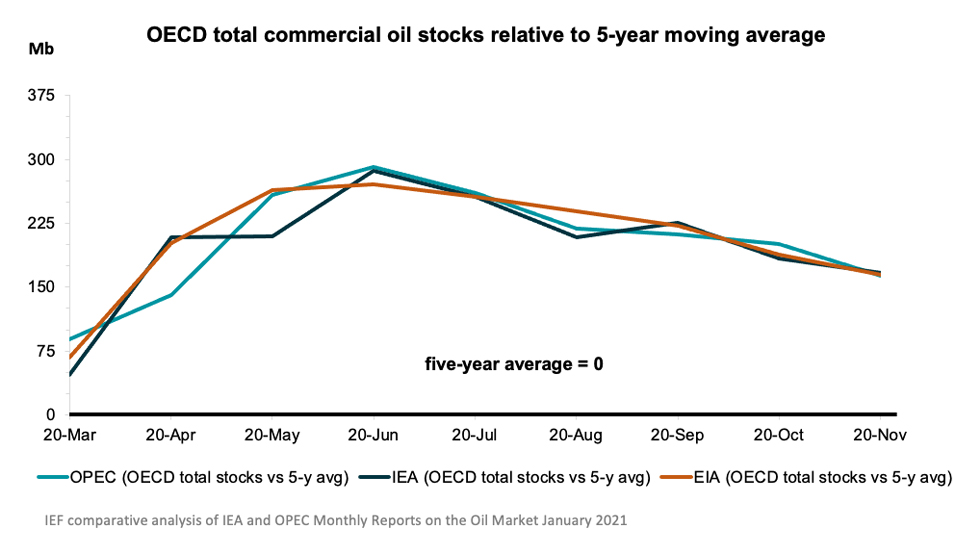
The IEA, OPEC, and EIA continue to report strong alignment on stock figures. The IEA reports OECD stock levels at 3108 mb, which is close to OPEC’s assessment of 3104 mb and EIA’s assessment of 3091 mb, for OECD stock that is 166.7 mb, 163.1 mb, and 165 mb above the five-year average, respectively. The divergence between the IEA, OPEC, and EIA stands at 17 mb. Total US crude inventories (excluding SPR) amount to about 477 mb according to the EIA which are about 5 percent above the five-year average for this time of year. OPEC reports US commercial crude oil stocks at about 485 mb and around 39 mb above the five-year average.
2.4 Snapshot (mb/d)
3. Global Analysis
3.1 Demand Data
Figure 1
IEA, OPEC, and EIA show swift demand recovery in 2021
All three organisations show alignment on demand growth
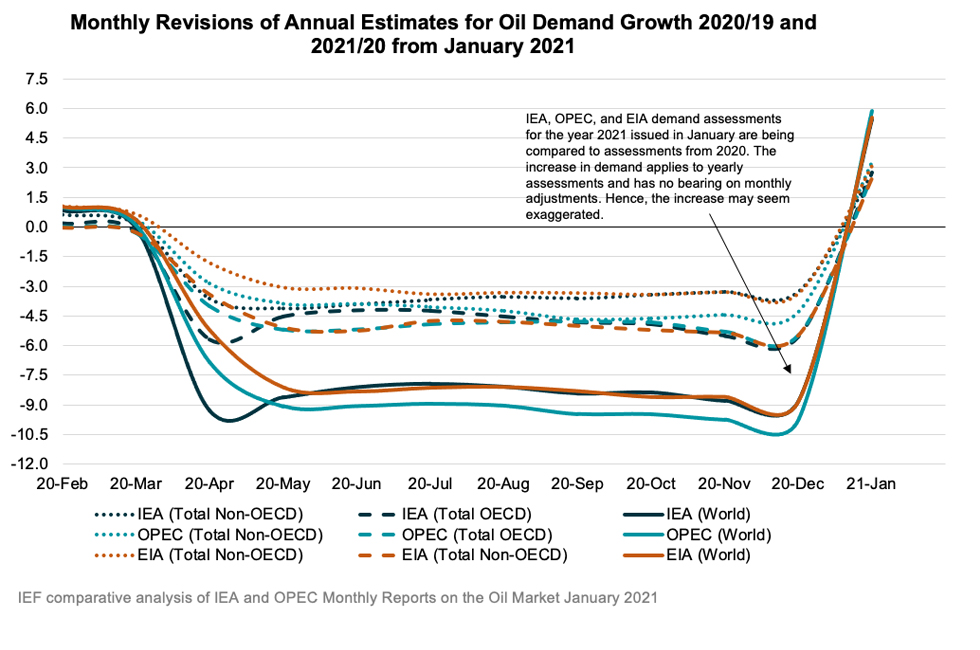
Absolute Demand
- The IEA’s estimate for global demand increased to 5.45 mb/d in January for an absolute demand of 96.64 mb/d in 2021 due to positive sentiment caused by the vaccine roll-out and the increased potential for economic recovery.
- As the traditional driver of demand growth, demand in non-OECD Asia reports growth of 1.72 mb/d in 2021.
- OPEC’s global demand assessment reports a total y-o-y increase of 5.90 mb/d in 2021 with absolute demand at 95.91 mb/d.
- The EIA also revised up its assessment with a demand growth of 5.56 mb/d y-o-y for an absolute demand of 97.77 mb/d.
OECD Demand
- The IEA reports an OECD oil demand growth of 2.74 mb/d with the Americas comprising most of the increase at 1.59 mb/d. The IEA anticipates total OECD consumption for 2021 at 44.78 mb/d.
- OPEC’s demand projection for the OECD region is 2.59 mb/d with the Americas comprising most of the increase at 1.58 mb/d for an absolute 2021 demand at 44.75 mb/d.
- The EIA’s assessment for OECD demand growth is 2.47 mb/d with the Americas comprising most of the increase at 1.67 mb/d for an absolute 2021 demand at 44.39 mb/d.
Non-OECD Demand
- The IEA, OPEC, and EIA anticipate increases in non-OECD demand for this year of 2.72, mb/d, 3.31 mb/d, and 3.09 respectively, diverging by 0.59 mb/d. This is driven largely by Asia, Middle East, and the Americas. Total non-OECD demand forecasts average 51.86 mb/d, 51.17 mb/d, and 53.38 mb/d respectively, diverging by 2.21 mb/d.
China Demand
- Overall demand in 2021 will be 14.65 mb/d, an increase of 750 kb/d from last year according to the IEA.
- Overall demand in 2021 will be 13.99 mb/d, an increase of 1.10 mb/d from last year according to OPEC.
- Overall demand in 2021 will be 15.16 mb/d, an increase of 850 kb/d from last year according to the EIA.
India Demand
- According to the IEA, Indian demand is expected to increase by 380 kb/d in 2021 to reach a total demand of 5.04 mb/d.
- Overall demand will increase by 570 kb/d with total demand of 4.76 mb/d in 2021. according to OPEC.
- The EIA forecasts overall demand at 4.86 mb/d in 2021, an increase of 500 kb/d from last year.
3.2 Supply Data
Figure 2
IEA, OPEC, and EIA are aligned on overall supply growth in 2021
EIA is slightly more optimistic on Non-OPEC supply
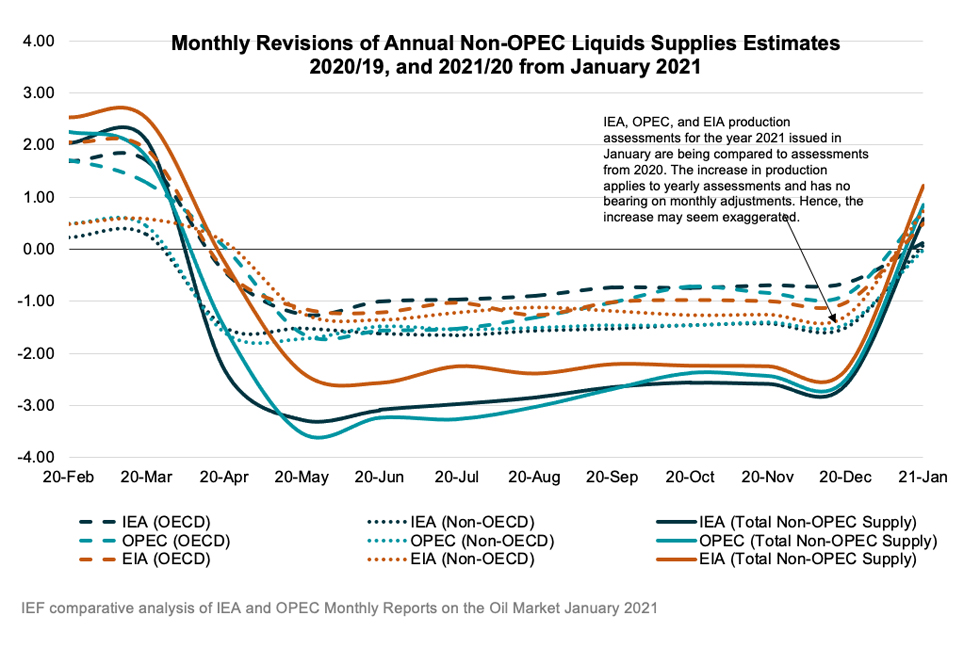
Non-OPEC Supply
- The IEA forecasts non-OPEC supply at 63.61 mb/d with an adjusted supply growth of 0.58 mb/d for 2021.
- OPEC’s January assessment of total non-OPEC supply for 2021 stands at 63.53 mb/d with a total growth of 0.85 mb/d. Most of the increase comes from the US (0.37 mb/d), Canada (0.25 mb/d), Brazil (0.17 mb/d), and Norway (0.13 mb/d).
- The EIA’s assessment for non-OPEC supply is at 64.89 mb/d with a supply growth of 1.22 mb/d.
OECD Supply
- The IEA forecasts OECD supplies to increase by 0.12 mb/d for 2021. OPEC reports supply growth at 0.72 mb/d, and the EIA sees growth at 0.49 mb/d with total supply reaching 27.97 mb/d, 29.85 mb/d, and 31.15 mb/d, respectively in 2021 and diverging by 3.18 mb/d.
- The IEA’s data shows that OECD Americas oil supply increases by 40 kb/d to reach 23.84 mb/d in total. OPEC reports an increase of 610 kb/d with total oil supply reaching 25.31 mb/d in 2021. The EIA reports an increase of 460 kb/d for a total supply of 26.25 mb/d.
- The IEA’s assessment for OECD Europe supply records an increase by 60 kb/d for total production of 3.57 mb/d led primarily by Norway. OPEC’s assessment for total OECD Europe production in 2021 is 4.01 mb/d with a growth of 120 kb/d. The EIA reports an increase of 110 kb/d for a total supply of 4.37 mb/d.
OPEC Supply
- The IEA reports that OPEC production increased by 150 kb/d m-o-m in December to reach total production of 25.20 mb/d led by Libya.
- OPEC reports that total OPEC-13 crude oil production averaged 25.36 mb/d in December according to secondary sources which is an increase of 280 kb/d m-o-m. Crude oil output increased primarily in Libya, Iraq, and the UAE.
- The EIA reports OPEC production increased by 230 kb/d m-o-m in December for a total production of 25.26 mb/d.
3.3 Stock Data
- IEA data shows OECD commercial inventories fell by 23.6 mb m-o-m in November to 3108 mb and are 166.7 mb above the five-year average. Crude oil inventories dropped by only 3.8 mb while product stocks fell by 23.1 mb. Other oils, including NGLs and feedstocks drew by 3.3 mb.
- According to OPEC, preliminary data for November showed that total OECD commercial oil inventories fell by 24.5 mb m-o-m to 3104 mb and are now 163.1 mb above the latest five-year average. OPEC estimates a crude draw of 11.2 mb while product stocks fell by 13.3 mb.
- EIA estimates OECD inventories dropped by 26.8 mb in November to 3,091 mb – 165 mb above the five-year average.
JODI Data:
- US crude oil closing stock levels rose by 2.70 mb m-o-m in November to 1134.85 mb.
- Japanese crude oil stock levels in October were revised downward by 9.39 mb and its November figure is virtually unchanged month-on-month at 374.93 mb.
- Korean crude oil closing stock levels fell by 6.84 mb m-o-m in November to 124.61 mb.
- German crude oil closing stock levels in November rose m-o-m by 2.61 mb to 153.87 mb.
- UK crude oil closing stock levels in November fell m-o-m by 2.15 mb to 25.78 mb – the lowest level since monitoring began in 2002.
While both the IEA and OPEC report closely aligned data on OECD stocks due to a continuous and reliable data stream and data harmonisation efforts, comprehensive data on stock developments for non-OECD countries is still work in progress as large differences in assessments show.
Figure 3
IEA and OPEC data show alignment on OECD stock builds
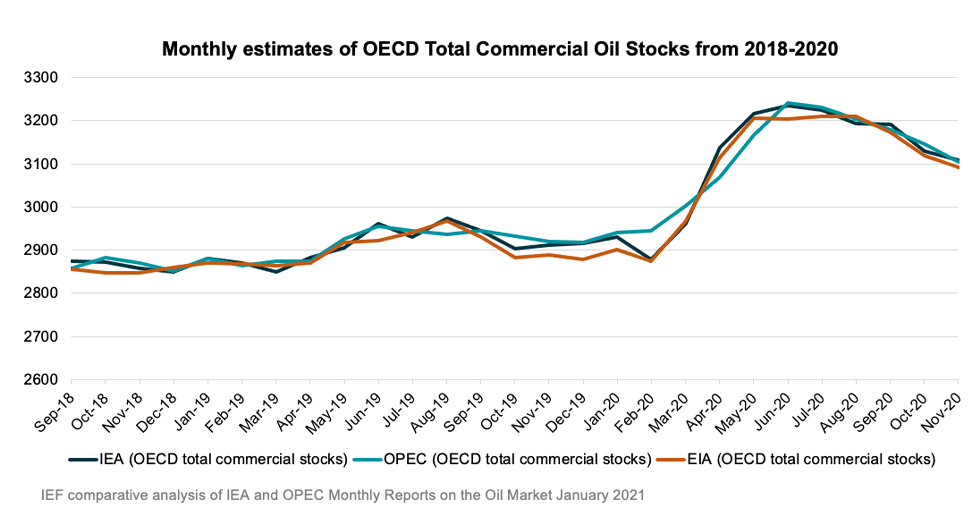
Figure 4
Stock decline rates by the IEA and OPEC converge
OECD stocks remain well above five-year average
3.3.1 Global Stock Analysis
IEA, JODI, and available weekly inventory data for November imply crude oil, NGL, and product stocks tumbled for a fourth consecutive month by ~46.7 mb.
- JODI non-OECD data shows inventories increased by 11.5 mb including a 9.9 mb product build and a 1.3 mb crude build. Products in India built by 5.1 mb after drawing in five of the past six months. Products also built in Taiwan (1.4 mb), Saudi Arabia (1.0 mb), Bahrain (0.8 mb), and Nigeria (0.6 mb). Crude builds in Brazil (2.8 mb), Iraq (2.2 mb), and Thailand (1.5 mb) were partially offset by draws in Gabon (-2.6 mb) and India (-2.0 mb).
- Floating crude inventories fell by 35.4 mb in November and 7.9 mb in December. They are now 118.2 mb below their June peak, but remain ~50 mb above year-ago levels.
- Rapidan Energy Group’s preliminary global inventory estimate for December shows visible inventories tumbled by 45.9 mb. Early data shows OECD commercial inventories dropped for a fifth consecutive month in December including a 30.8 mb decline in OECD product stocks.
- Preliminary data shows global inventories drew by ~273.7 mb in 2H20, led by a 118.2 mb drop in floating crude and a 105.3 mb drop in OECD commercial product stocks.
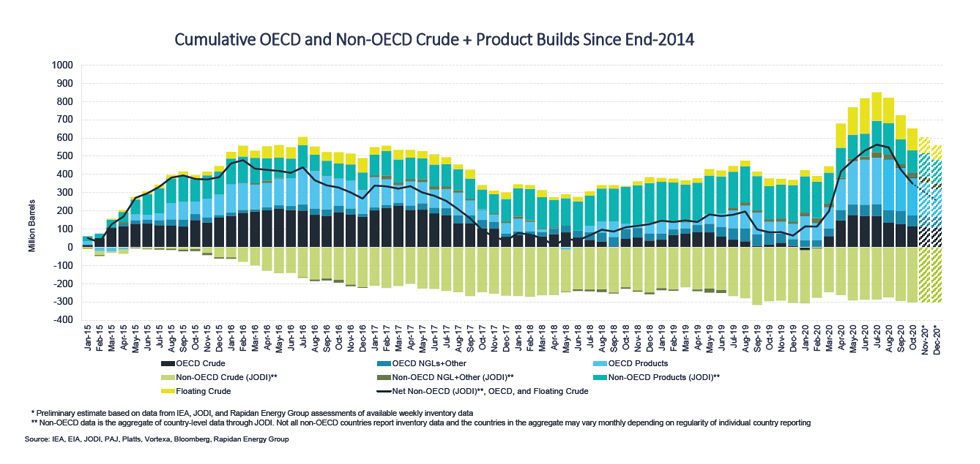
- IEA, OPEC, and EIA’s global oil balances continue to imply the market was oversupplied by ~1.2-1.5 billion barrels in 1H20 and undersupplied by 0.2-0.4 billion barrels in 2H20, suggesting the market has cleaned up ~13-30% of the 1H20 surplus. However, inventory data only shows a 466.2 mb build in 1H20 and a 273.7 mb draw in 2H20, implying nearly 60% of the 1H20 builds have been reversed.
Table 1
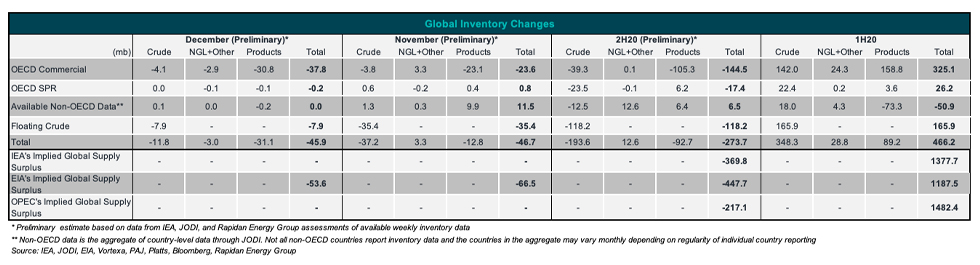
Figure 5
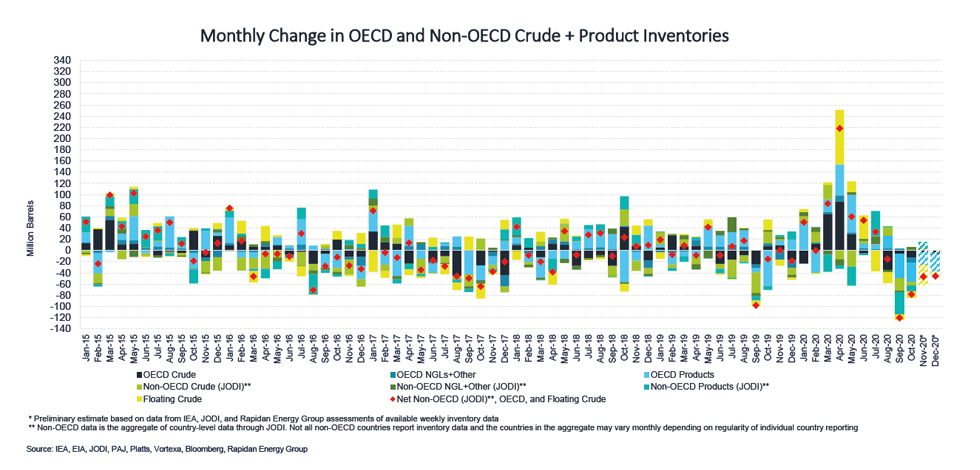
Figure 6
Explanatory Note
The IEF conducts a comprehensive comparative analysis of the short-, medium-, and long-term energy outlooks of the IEA, OPEC, and the EIA, to inform the IEA-IEF-OPEC Symposium on Energy Outlooks that the IEF hosts in Riyadh as part of the trilateral work programme on a yearly basis.
To inform IEF stakeholders on how perspectives on the oil market of both organisations evolve over time more regularly, this monthly summary provides:
- An overview of key events and initiatives in the international policy and market context.
- Key findings and a snapshot overview of data points gained from comparing basic historical data and short-term forecasts of the IEA Oil Market Report and the OPEC Monthly Oil Market Report.
- A comparative analysis of oil inventory data reported by JODI, the IEA, OPEC, the US EIA and secondary sources in collaboration with the Rapidan Energy Group.
The International Energy Forum
The International Energy Forum is the leading global facilitator of dialogue between sovereign energy market participants. It incorporates members of International Energy Agency and the Organization of the Petroleum Exporting Countries, and also key players including China, India, Russia and South Africa. The forum's biennial ministerial meetings are the world's largest gathering of energy ministers, where discussions focus on global energy security and the transition towards a sustainable and inclusive energy future. The forum has a permanent secretariat of international staff based in the Diplomatic Quarter of Riyadh, Saudi Arabia. For more information visit www.ief.org.