")

Comparative Analysis of Monthly Reports on the Oil Market
1. International Policy and Market Context
Cold Weather and Soaring Electricity Demand in the US Cause Blackouts and Oil Production Shortages
- Power outages in the US, with Texas most affected, impacted millions of households due to winter temperatures at 30-year lows. Power demand reached an all-time high as Arctic air pushed south to the Gulf of Mexico. The polar vortex forced power plants to purchase electricity on the spot market leading to a price spike and power outages. US oil production was also down by about 5 mb/d due to lost power and extreme weather conditions.
Oil Prices Rise to Pre-Pandemic Levels
- Positive market sentiment caused by the global vaccine rollout, increasing demand, particularly in Asia, and production disruptions due to cold weather in the US pushed Brent above $60 per barrel. Brent crude futures contracts have increased by almost 60 percent since November while WTI prices rose to one-year highs. However, continued lockdowns in certain parts of the world, mobility restrictions, and differences in vaccine distribution makes oil market rebalancing a gradual and uncertain process.
The IEF hosts the 11th IEA-IEF-OPEC Symposium on Energy Market Outlooks
- The 11th iteration of the Symposium was livestreamed and examined the impact of the COVID-10 pandemic on global energy markets and the outlook for global energy security and market stability.
- HRH Prince Abdulaziz bin Salman, Minister of Energy of Saudi Arabia acknowledged the progress made in bringing stability to oil markets, but warned against complacency, emphasised caution, and stressed the importance of adaptation and resilience in an unpredictable environment.
- HE Dharmendra Pradhan, Indian Minister of Petroleum and Natural Gas, reiterated that in the collective interests of both producing and consuming countries oil prices should be reasonable and responsible.
- The Director-General of the International Renewable Energy Agency (IRENA), HE Francesco La Camera, and Secretary General of the Gas Exporting Countries Forum (GECF), HE Yury Sentyurin were also invited to speak.
26th Meeting of the Joint Ministerial Monitoring Committee (JMMC) Optimistic for Recovery in 2021
- The 26th JMMC on 3 February 2021 emphasised the importance of accelerating market rebalancing without delay. The Committee also observed that stocks in OECD countries fell for the fifth consecutive month. It was also noted that while economic prospects and oil demand growth would remain uncertain in the coming months, the gradual rollout of vaccines around the world is a positive factor for oil demand and global economic recovery.
2. Key Points
2.1 Demand
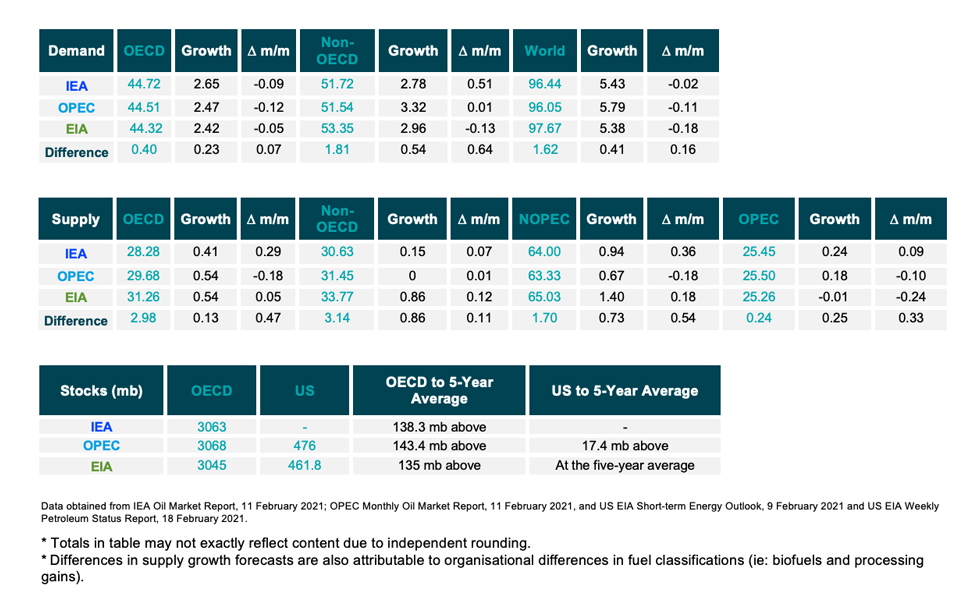
The IEA, OPEC, and EIA show alignment on demand growth in 2021.
- The IEA decreased its assessment by 20 kb/d for a year-on-year (y-o-y) demand growth of 5.43 mb/d due to a positive economic outlook and gradual drawdown of surplus crude inventories.
- OPEC’s forecasts a y-o-y demand growth of 5.79 mb/d, a decrease of 110 kb/d from last month.
- EIA’s assessment decreases by 180 kb/d for a demand growth of 5.38 mb/d in 2021. The IEA, OPEC, and EIA estimates for absolute world demand are now 96.44 mb/d 96.05 mb/d, and 97.67 mb/d for 2021, respectively.
The IEA, OPEC, and EIA align on OECD and non-OECD demand growth.
- The IEA’s non-OECD demand assessment increases by 510 kb/d to a demand growth of 2.78 mb/d, while OPEC increases its assessment by 10 kb/d for a growth of 3.32 mb/d. The EIA’s assessment decreases by 130 kb/d for non-OECD demand growth of 2.96 mb/d y-o-y.
- The IEA’s estimate for OECD demand decreased by 90 kb/d for demand growth at 2.65 mb/d for 2021. OPEC’s estimate decreased by 120 kb/d for a demand growth at 2.47 mb/d while EIA’s assessment sees growth at 2.42 mb/d y-o-y, a decrease of 50 kb/d.
- IEA, OPEC, and EIA assessments differ by 230 kb/d and 540 kb/d on OECD and non-OECD demand growth, respectively.
2.2 Supply
The IEA, OPEC, and EIA show differences in non-OPEC supply growth.
- The IEA's February assessment for non-OPEC supply increases by 360 kb/d for a total growth of 0.94 mb/d while OPEC reports total growth of 0.67 mb/d, a decrease of 180 kb/d. The EIA reports a higher overall supply growth of 1.40 mb/d y-o-y, an increase of 180 kb/d from last month’s assessment. In absolute values, the IEA, OPEC, and EIA estimate non-OPEC supply at 64.00 mb/d, 63.33 mb/d, and 65.03 mb/d, respectively for 2021.
- The IEA reports OECD supply growth at 410 bb/d while OPEC records OECD growth at 540 kb/d, an increase and decrease of 290 kb/d and 180 kb/d, respectively. The EIA also records a growth of 540 kb/d, an increase of 50 kb/d. In absolute values, the IEA and OPEC, and EIA estimate OECD supply at 28.28 mb/d, 29.68 mb/d, and 31.26 mb/d, respectively for 2021 and diverging by 2.98 mb/d.
Non-OECD supply growth varies amongst the IEA, OPEC, and EIA.
- The IEA's supply assessment reaches total supply growth of 150 kb/d, an increase of 70 kb/d while OPEC’s forecast reports no growth, a slight increase of 10 kb/d. The EIA is more optimistic with a growth of 860 kb/d, an increase of 120 kb/d from last month. In absolute values, the IEA, OPEC, and EIA non-OECD supply estimates are 30.63 mb/d and 31.45 mb/d, and 33.77 mb/d, respectively for 2021 diverging by 3.14 mb/d.
The IEA, OPEC report increases in OPEC production in January while EIA posts a small decrease.
- The IEA revised its OPEC production by 240 kb/d month-on-month (m-o-m) in January to reach total production of 25.45 mb/d. OPEC also reported an increase by 180 kb/d m-o-m for total production of 25.50 mb/d in January. The EIA meanwhile decreased its assessment by 10 kb/d or total OPEC crude production of 25.26 mb/d in January.
2.3 Stocks
The IEA, OPEC, and EIA continue to report strong alignment on stock figures. . The IEA reports OECD stock levels at 3063 mb, which is close to OPEC’s assessment of 3068 mb and EIA’s assessment of 3045 mb, or for OECD stock that is 138.3 mb, 143.4 mb, and 135 mb above the five-year average, respectively. Total US crude inventories (excluding SPR) amount to about 462 mb according to the EIA which are at the five-year average for this time of year. OPEC reports US commercial crude oil stocks at about 476 mb and around 17 mb above the five-year average.
2.4 Snapshot (mb/d)
3. Global Analysis
3.1 Demand Data
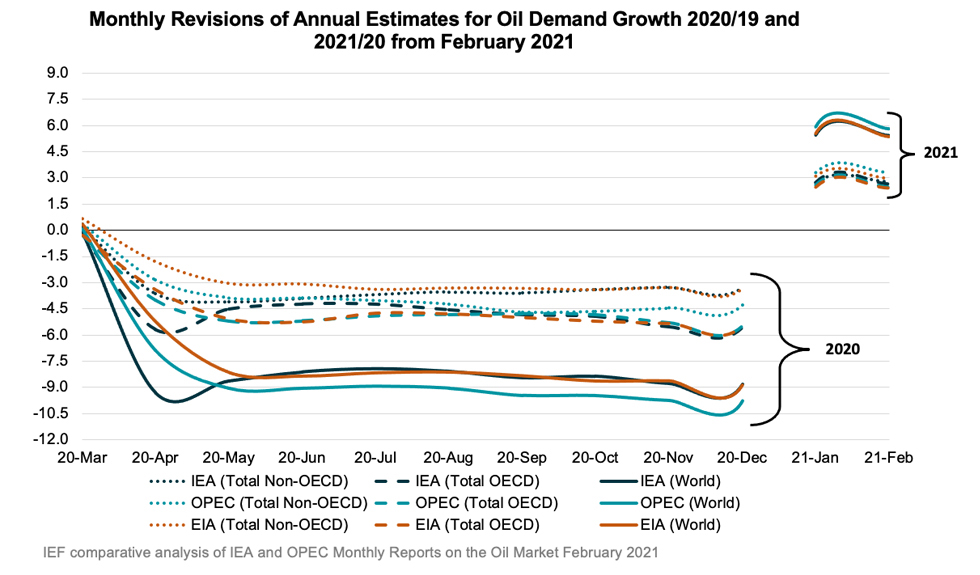
Figure 1
IEA, OPEC, and EIA show lesser overall demand growth
OPEC reports more non-OECD demand growth than IEA and EIA
Absolute Demand
- The IEA’s estimate for global demand growth decreased slightly by to 5.43 mb/d in February for an absolute demand of 96.44 mb/d in 2021 due to positive economic sentiment and draw-down in inventory levels.
- As the traditional driver of demand growth, demand in non-OECD Asia reports growth of 1.84 mb/d in 2021, an increase of 120 kb/d from January’s assessment.
- OPEC’s global demand assessment decreases by 110 kb/d for a total y-o-y increase of 5.79 mb/d in 2021 with absolute demand at 96.05 mb/d.
- The EIA also revised up down its assessment by 180 kb/d with a demand growth of 5.38 mb/d y-o-y for an absolute demand of 97.67 mb/d.
OECD Demand
- The IEA decreases its assessment by 90 kb/d for OECD oil demand growth of 2.65 mb/d with the Americas comprising most of the increase at 1.57 mb/d. The IEA anticipates total OECD consumption for 2021 at 44.72 mb/d.
- OPEC’s demand projection for the OECD region decreased by 120 kb/d for y-o-y growth of 2.47 mb/d with the Americas comprising most of the increase at 1.60 mb/d for absolute demand at 44.51 mb/d.
- The EIA’s assessment for OECD demand growth decreases by 50 kb/d to 2.42 mb/d with the Americas comprising most of the increase at 1.60 mb/d for an absolute demand at 44.32 mb/d.
Non-OECD Demand
- The IEA, OPEC, and EIA anticipate increases in non-OECD demand for this year of 2.78, mb/d, 3.32 mb/d, and 2.96 mb/d respectively, diverging by 0.54 mb/d. This is driven largely by Asia, Middle East, and the Americas. Total non-OECD demand forecasts average 51.72 mb/d, 51.54 mb/d, and 53.35 mb/d respectively, diverging by 1.81 mb/d.
China Demand
- Overall demand in 2021 will be 14.79 mb/d, an increase of 860 kb/d from last year according to the IEA.
- Overall demand in 2021 will be 14.14 mb/d, an increase of 1.10 mb/d from last year according to OPEC.
- Overall demand in 2021 will be 15.13 mb/d, an increase of 820 kb/d from last year according to the EIA.
India Demand
- According to the IEA, Indian demand is expected to increase by 380 kb/d in 2021 to reach a total demand of 4.92 mb/d.
- Overall demand will increase by 590 kb/d with total demand of 4.99 mb/d in 2021. according to OPEC.
- The EIA forecasts overall demand at 4.85 mb/d in 2021, an increase of 480 kb/d from last year.
3.2 Supply Data
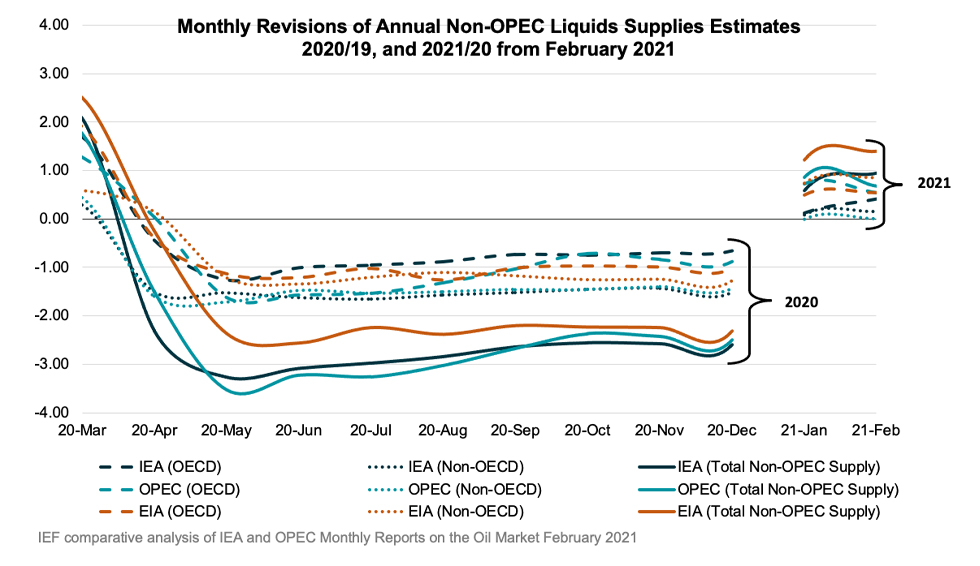
Figure 2
IEA, OPEC, and EIA show differences in supply growth
All three organisations converge on OECD supply growth
Non-OPEC Supply
- The IEA forecasts non-OPEC supply at 64.00 mb/d with an adjusted supply growth of 0.94 mb/d for 2021, an increase of 360 kb/d. Most of the growth comes from Canada (0.38 mb/d), Brazil (0.16 mb/d), Russia (0.11 mb/d), and Norway (0.13 mb/d).
- OPEC’s February assessment of total non-OPEC supply for 2021 stands at 63.33 mb/d for a total growth of 0.67 mb/d, a decrease of 180 kb/d. Most of the growth comes from Canada (0.27 mb/d), Brazil (0.17 mb/d), US (0.16 mb/d), and Norway (0.13 mb/d).
- The EIA’s assessment for non-OPEC supply is at 65.03 mb/d with a supply growth of 1.40 mb/d. Most of the growth comes from Canada (0.50 mb/d), Brazil (0.39 m b/d), Norway (0.20 mb/d), and Russia (0.16 mb/d).
OECD Supply
- The IEA forecasts OECD supplies to increase by 0.41 mb/d for 2021 while OPEC and the EIA see growth at 0.54 mb/d with total supply reaching 28.28 mb/d, 29.68 mb/d, and 31.26 mb/d, respectively in 2021 and diverging by 2.98 mb/d.
- The IEA’s data shows that OECD Americas oil supply increases by 330 kb/d to reach 24.16 mb/d in total. OPEC reports an increase of 430 kb/d with total oil supply reaching 25.14 mb/d in 2021. The EIA reports an increase of 500 kb/d for a total supply of 26.33 mb/d.
- The IEA’s assessment for OECD Europe supply records an increase by 60 kb/d for total production of 3.57 mb/d led primarily by Norway. OPEC’s assessment for total OECD Europe production in 2021 is 4.01 mb/d with a growth of 120 kb/d. The EIA reports an increase of 110 kb/d for a total supply of 4.38 mb/d.
OPEC Supply
- The IEA reports that OPEC production increased by 240 kb/d m-o-m in January to reach total production of 25.45 mb/d led by Saudi Arabia.
- OPEC reports that total OPEC-13 crude oil production averaged 25.50 mb/d in January according to secondary sources which is an increase of 180 kb/d m-o-m. Crude oil output increased primarily in Saudi Arabia, Venezuela, and Iran.
- The EIA reports OPEC production decreased by 10 kb/d m-o-m in January for a total production of 25.26 mb/d.
3.3 Stock Data
- IEA data shows OECD commercial inventories fell by 44.6 mb m-o-m in December to 3063 mb and are 138.3 mb above the five-year average. Crude oil inventories dropped by only 1.1 mb while product stocks fell by 32.7 mb. Other oils, including NGLs and feedstocks drew by 10.8 mb.
- According to OPEC, preliminary data for December showed that total OECD commercial oil inventories fell by 39.3 mb m-o-m to 3068 mb and are now 143.4 mb above the latest five-year average. OPEC estimates a crude draw of 24.2 mb while product stocks fell by 15.1 mb.
- EIA estimates OECD inventories dropped by 52.8 mb in December to 3045 mb – 135 mb above the five-year average.
JODI Data:
- US crude oil closing stock levels fell by 14.96 mb m-o-m in December to 1123.54 mb.
- Japanese crude oil stock levels were revised downward by 10.17 mb and its December figure virtually unchanged m-o-m at 364.92 mb.
- Korean crude oil closing stock levels rose by 714 kb mb m-o-m in December to 125.32 mb.
- German crude oil closing stock levels in December rose m-o-m by 325 kb to 153.11 mb.
- UK crude oil closing stock levels in December rose m-o-m by 1.26 mb to 27.67 mb.
While both the IEA and OPEC report closely aligned data on OECD stocks due to a continuous and reliable data stream and data harmonisation efforts, comprehensive data on stock developments for non-OECD countries is still work in progress as large differences in assessments show.
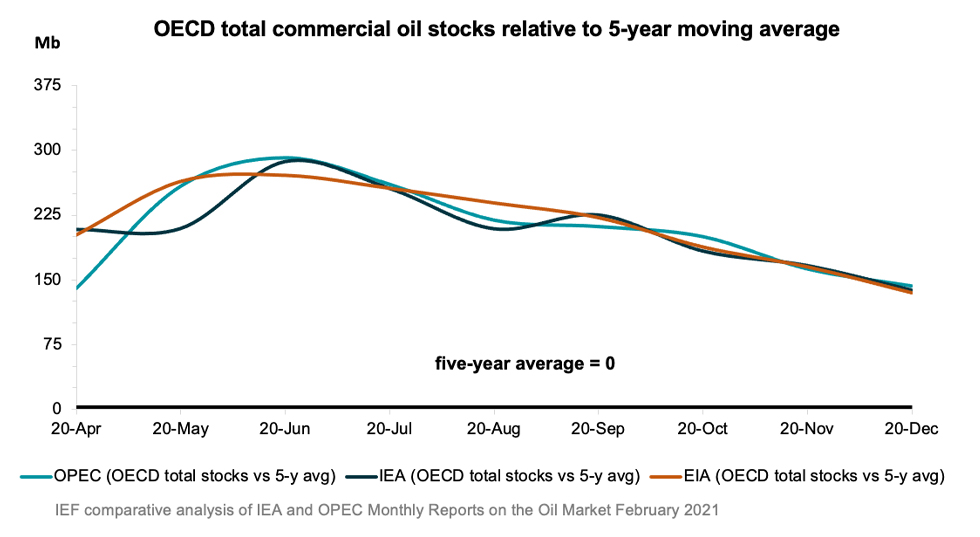
Figure 3
IEA and OPEC data show alignment on OECD stock builds
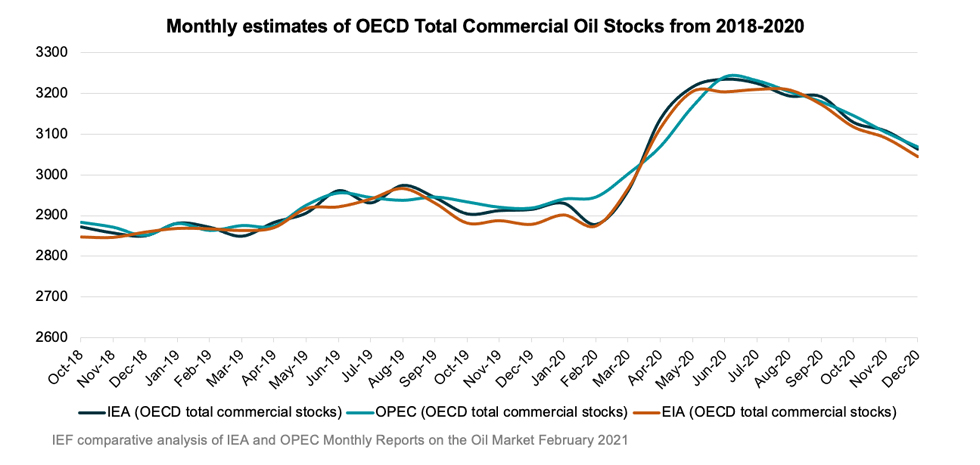
Figure 4
Stock decline rates by the IEA and OPEC converge
OECD stocks remain well above five-year average
3.3.1 Global Stock Analysis
IEA, JODI, and available weekly inventory data for December imply crude, NGL, and product stocks tumbled for a fifth consecutive month by ~84.3 mb.
- JODI non-OECD data for December shows inventories decreased by 24.0 mb including a 7.9 mb crude draw and a 15.6 mb product draw. Products in drew in Indonesia (13.0 mb), Nigeria (1.5 mb), Thailand (0.5 mb), and Chinese Taipei (3.1 mb). Crude stocks drew in Saudi Arabia (3.4 mb), Thailand (3.9 mb).
- Floating crude inventories fell by 7.9 mb in December and 32.3 mb in January. They are now 150.5 mb below their June peak.
- Rapidan Energy Group’s preliminary global inventory estimate for January shows visible inventories tumbled by 67.6 mb. Early data shows OECD commercial inventories dropped for a sixth consecutive month in January including a 7.6 mb decline in OECD product stocks.
- There is a wide divergence between preliminary data (total inventories drop by 67.6 mb) while EIA – the only agency with a monthly breakdown – is showing a slight 1.9 mb build. The builds in January are the first builds in EIA’s monthly balance since May and are partially driven by a higher-than-normal seasonal monthly drop in global demand (down 2.3 mb/d m/m from December to January).
- Preliminary data shows global inventories drew by ~347.9 mb in 2H20, led by a 171.8 mb drop in total OECD stocks and a 118.2 mb drop in floating crude.
Table 1
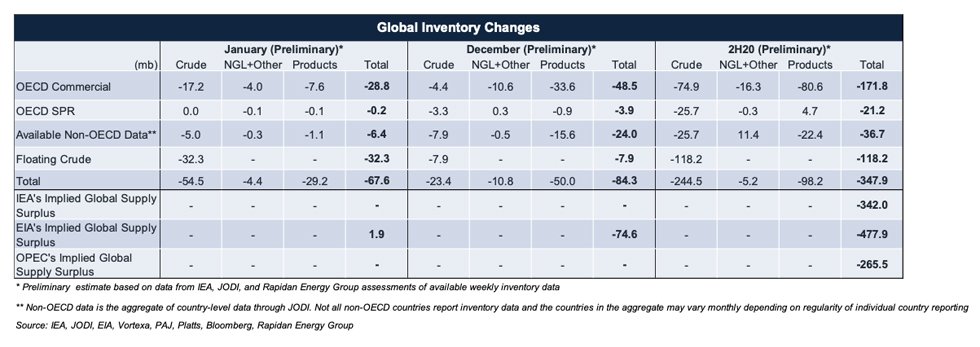
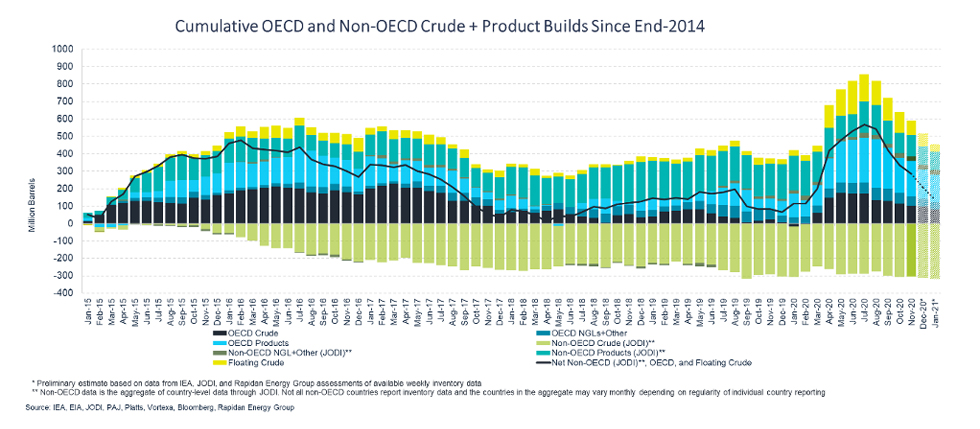
Figure 5
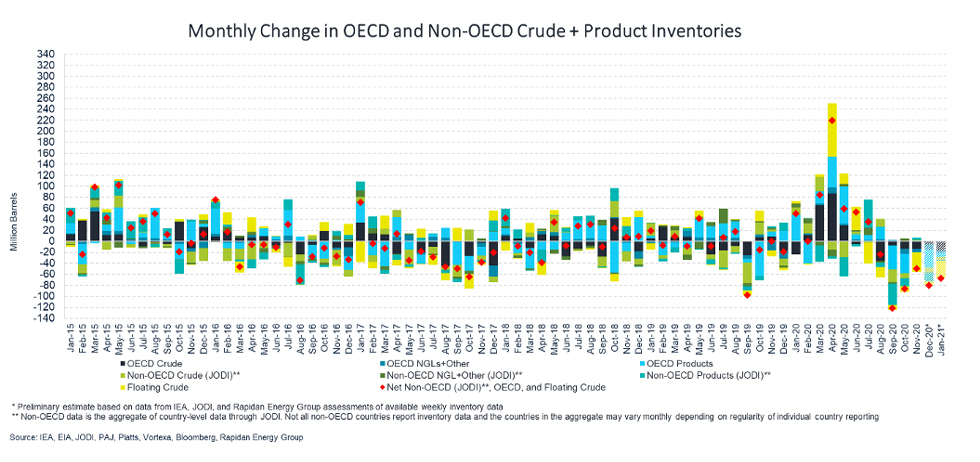
Figure 6
Explanatory Note
The IEF conducts a comprehensive comparative analysis of the short-, medium-, and long-term energy outlooks of the IEA OPEC, and the EIA to inform the IEA-IEF-OPEC Symposium on Energy Outlooks that the IEF hosts in Riyadh as part of the trilateral work programme on a yearly basis.
To inform IEF stakeholders on how perspectives on the oil market of both organisations evolve over time regularly, this monthly summary provides:
- An overview of key events and initiatives in the international policy and market context.
- Key findings and a snapshot overview of data points gained from comparing basic historical data and short-term forecasts of the IEA Oil Market Report and the OPEC Monthly Oil Market Report.
- A comparative analysis of oil inventory data reported by JODI, the IEA, OPEC, and the US EIA, and secondary sources in collaboration with the Rapidan Energy Group.
The International Energy Forum
The International Energy Forum is the leading global facilitator of dialogue between sovereign energy market participants. It incorporates members of International Energy Agency and the Organization of the Petroleum Exporting Countries, and also key players including China, India, Russia and South Africa. The forum's biennial ministerial meetings are the world's largest gathering of energy ministers, where discussions focus on global energy security and the transition towards an inclusive and sustainable energy future. The forum has a permanent secretariat of international staff based in the Diplomatic Quarter of Riyadh, Saudi Arabia. For more information visit www.ief.org.