")

Comparative Analysis of Monthly Reports on the Oil Market
1. International Policy and Market Context
Global Oil Demand to Reach Pre-Pandemic Levels in 2022
- Global oil demand is set to rise in 2021 by 5.4 mb/d before growing at 3.1 mb/d next year to average 100 mb/d by the end of 2022 according to the International Energy Agency. Brent crude climbed past $70 per barrel party due to post-COVID recovery efforts, but the recovery is expected to be uneven across regions of the world, and the rebound in demand will vary across sectors and products while supply will likely not recover as fast.
OECD Oil Inventories Fall Below the Five-Year Average
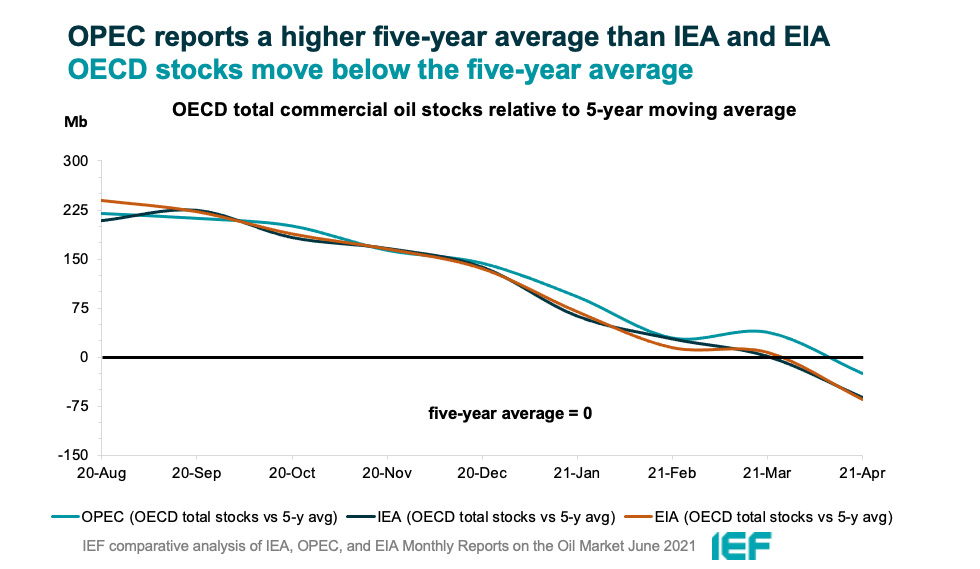
- The IEA, OPEC, and EIA report oil inventories below the five-year average for the first time in over a year. Increase in vaccinations and a rise in global mobility coupled with easing restrictions are seeing greater stock draws headed into the summer months. Still, inventories remain unusually high, and a surge in COVID-19 cases in several countries along with other oil supply developments create market uncertainty.
17th OPEC and non-OPEC Ministerial Meeting Agrees to Continued Easing of Production Adjustments
- On 1 June, the 17th iteration of the meeting reconfirmed the existing commitment of the 10th OPEC and non-OPEC Ministerial Meeting in April 2020, amended in June, September, and December 2020, as well as in January and April 2021 to gradually return 2 mb/d of the adjustments to the market, with the pace being determined according to market conditions. The 18th OPEC and non-OPEC Ministerial Meeting is scheduled for 1 July 2021.
G7 Summit Outlines Climate Commitments
- On 11-13 June, the G7 countries outlined further steps to Build Back Better including efforts to mitigate the impacts of climate change. The Carbis Bay G7 communique outlines key climate commitments including delivering climate targets in line with limiting the rise in global temperatures to 1.5 degrees Celsius, achieving net-zero emissions by 2050 at the latest, focusing on transitioning away from coal, and conserving or protecting at least 30 percent of global land and oceans by 2030.
2. Key Points
2.1 Demand
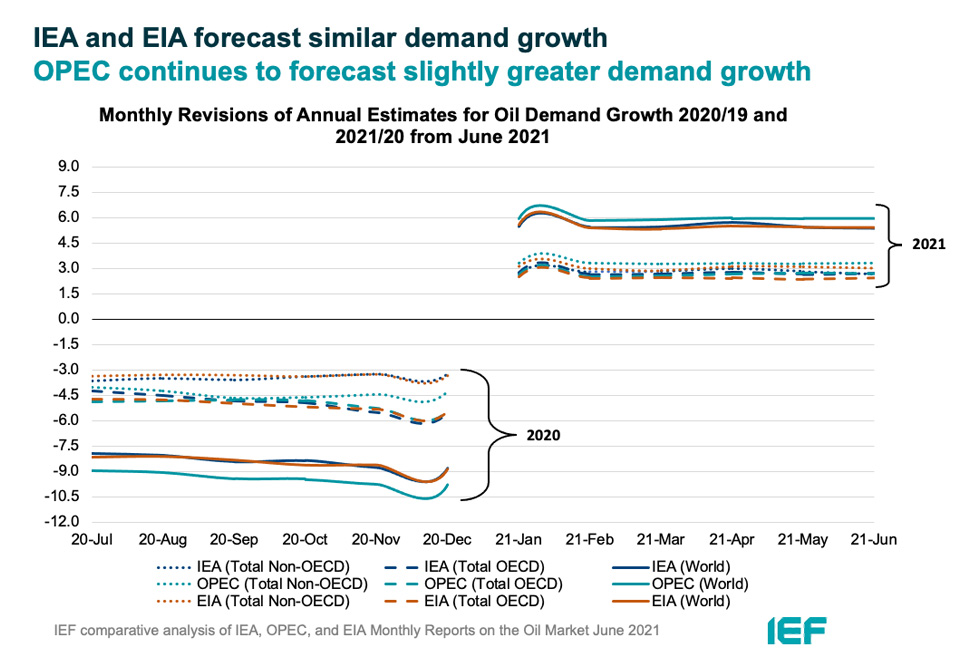
The IEA and EIA demand growth assessments decrease slightly while OPEC growth remains static for the third month in a row.
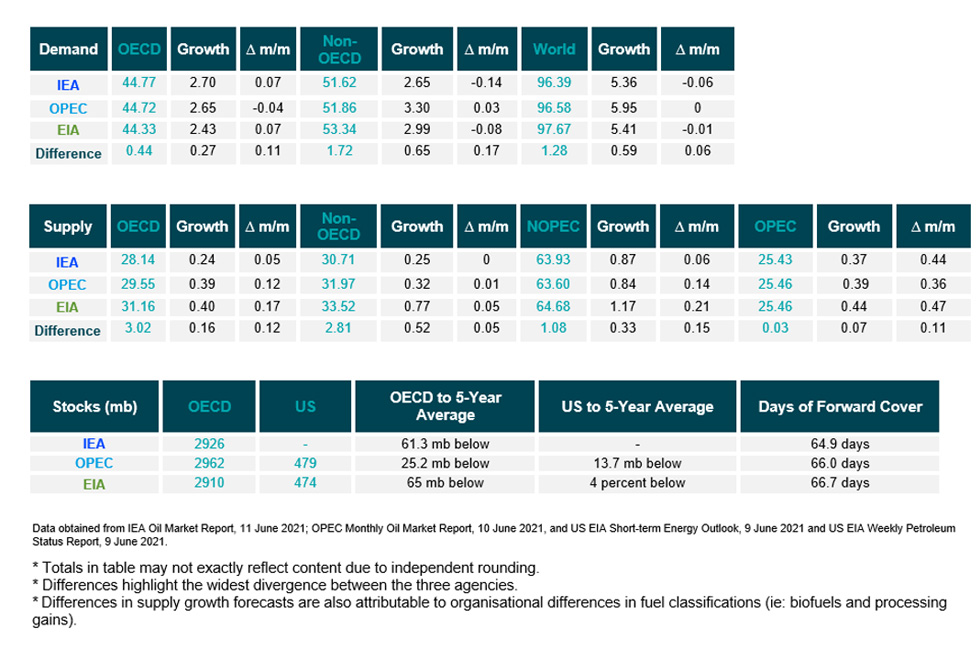
- The IEA reduced its assessment of year-on-year (y-o-y) demand growth by 60 kb/d to 5.36 mb/d. Global oil demand is set to return to pre-pandemic levels by the end of 2022.
- OPEC's y-o-y demand growth estimate remains the same as last month at 5.95 mb/d.
- EIA's assessment fell by 10 kb/d for a demand growth of 5.41 mb/d in 2021. The IEA, OPEC, and EIA estimates for absolute world demand are now 96.39 mb/d, 96.58 mb/d, and 97.67 mb/d for 2021, respectively.
The IEA, OPEC, and EIA OECD and non-OECD demand growth assessments remain stable.
- The IEA's assessment of y-o-y non-OECD demand growth falls by 140 kb/d 2.65 mb/d, while OPEC's increases by 30 kb/d to 3.30 mb/d. The EIA's assessment falls by 80 kb/d for a total non-OECD demand growth of 2.99 mb/d.
- The IEA's estimate for OECD demand rose by 70 kb/d to 2.70 mb/d for 2021. OPEC's estimate fell by 40 kb/d to 2.65 mb/d while EIA's assessment sees growth at 2.43 mb/d y-o-y, an increase of 70 kb/d.
- IEA and EIA assessments differ by 0.27 mb/d and IEA and OPEC assessments differ by 0.65 mb/d on OECD and non-OECD demand growth, respectively.
2.2 Supply
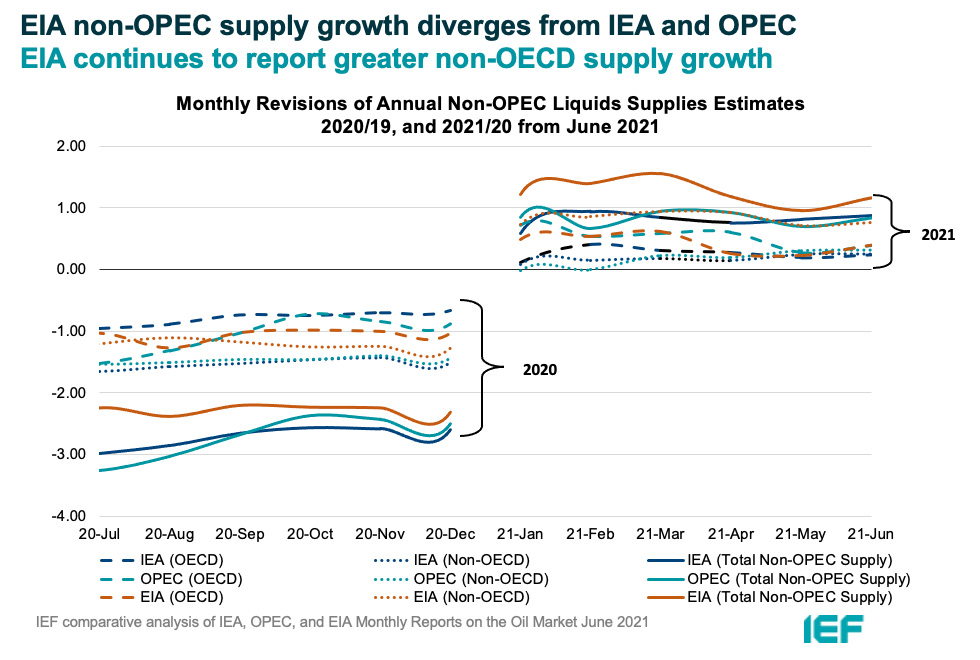
The EIA non-OPEC supply growth assessment begins to diverge.
- The IEA's June assessment for non-OPEC supply increases by 60 kb/d for a total growth of 0.87mb/d while OPEC reports total growth of 0.84 mb/d, an increase of 140 kb/d. The EIA reports a higher overall supply growth of 1.17 mb/d y-o-y, an increase of 210 kb/d from last month's assessment. In absolute values, the IEA, OPEC, and EIA estimate non-OPEC supply at 63.93 mb/d, 63.60 mb/d, and 64.68 mb/d, respectively for 2021.
- The IEA reports OECD supply growth at 0.24 mb/d while OPEC records OECD growth at 0.39 mb/d, an increase of 50 kb/d and 120 kb/d, respectively. The EIA also records an increase of 170 kb/d for a growth of 0.40 mb/d. In absolute values, the IEA and OPEC, and EIA estimate OECD supply at 28.14 mb/d, 29.55 mb/d, and 31.16 mb/d, respectively for 2021. Divergence on OECD supply growth is the largest between EIA and IEA differing by 160 kb/d.
The EIA reports higher non-OECD supply growth than the IEA and OPEC.
- The IEA's supply assessment is the same as last month at 0.25 mb/d. OPEC's forecast reports a growth of 0.32 mb/d, an increase of 10 kb/d from last month. The EIA is substantially more optimistic showing non-OECD supply growth of 0.77 mb/d, an increase of 50 kb/d from last month.
- In absolute values, the IEA, OPEC, and EIA non-OECD supply estimates are 30.71 mb/d and 31.97 mb/d, and 33.52 mb/d, respectively for 2021. Divergence on total non-OECD supply growth is widest between the IEA and EIA that differ by 520 kb/d.
The IEA and EIA report decreases while OPEC reports an increase in OPEC production in May.
- The IEA revised its OPEC production estimate upward by 440 kb/d month-on-month (m-o-m) in May to reach total production of 25.43 mb/d. OPEC, meanwhile reported an increase of 360 kb/d m-o-m for total production of 25.46 mb/d in May. The EIA also increased its assessment by 470 kb/d for total OPEC crude production of 25.46 mb/d.
2.3 Stocks
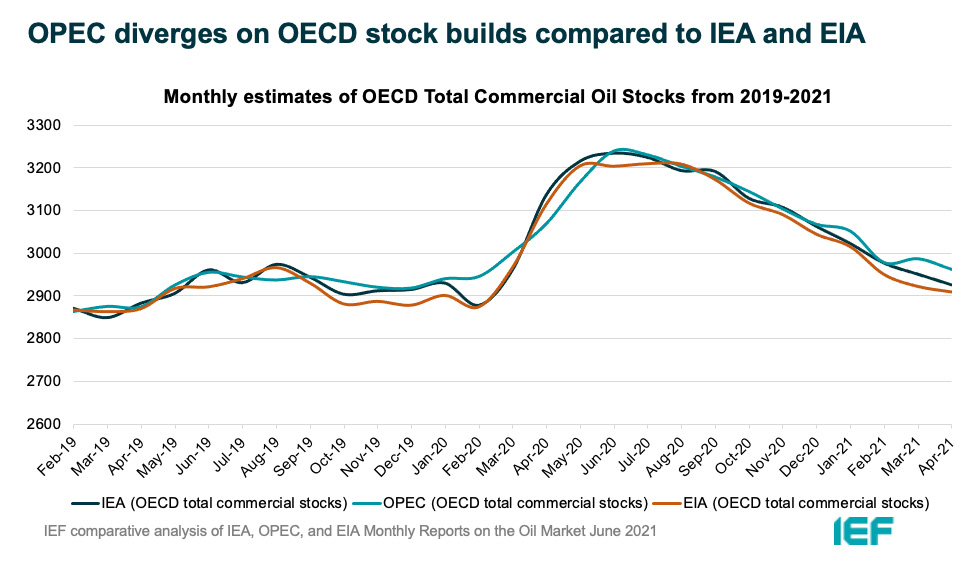
The IEA, OPEC, and EIA continue to report strong alignment on stock figures which are now below the five-year average.
- The IEA reports OECD stock levels at 2926 mb, which is close to OPEC's assessment of 2962 mb and EIA's assessment of 2910 mb which is 61.3 mb, 25.2 mb, and 66 mb below the five-year average, respectively.
- According to the IEA, crude oil inventories drew by 7.8 mb while product stocks built by about 1.4 mb. Other oils, including NGLs and feedstocks built by 6.8 mb. According to OPEC, crude oil stocks drew by 13.6 mb while products built by 7.2 mb.
- EIA estimates OECD inventories dropped by 35 mb in April to 2910 mb – 65 mb below the five-year average.
- The widest divergence in inventories is between OPEC and the EIA which stands at 52 mb. Total US crude inventories (excluding SPR) amount to about 474 mb according to the EIA which are 4 percent below the five-year average for this time of year. OPEC reports US commercial crude oil stocks at about 479 mb and around 25.2 mb below the five-year average.
2.4 Snapshot (mb/d)
3. Global Analysis
3.1 Demand Data
3.2 Supply Data
3.3 Global Stock Data
IEF-Kayrros Stock Analysis:
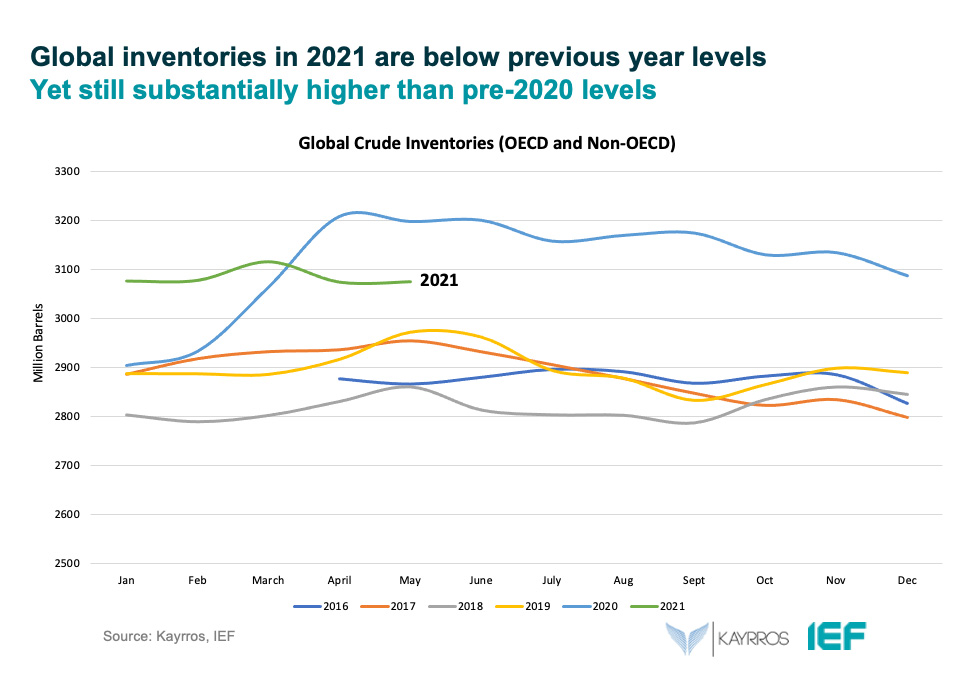
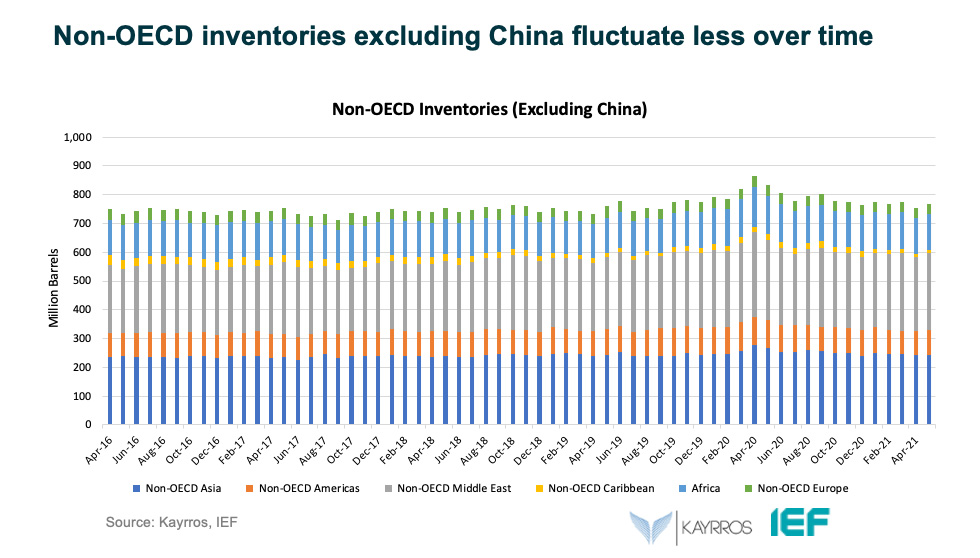
Global crude oil inventories in onshore storage ended May relatively unchanged from the previous month, according to Kayrros measurements of crude stocks in floating roof tanks and US EIA estimates of US stocks. In total, Kayrros measured a global build of about 4 million barrels for the month, or 130 kb/d.
This leaves global crude stocks about 120 million barrels below their year-earlier level, but still more than 110 million barrels above their level at end May 2019. Over the past 13 months, crude stocks have been slowly drawing down the global overhang built during the first Covid-19 lockdowns, from early February to early May 2020. As the pandemic dramatically slowed the global economy, global crude stocks had surged by nearly 300 million barrels, or more than 4 million bp/d, in just about 70 days. Since then, stocks have retraced about 44 percent their gains, edging down by just 320 kb/d on average over a period of more than a year.
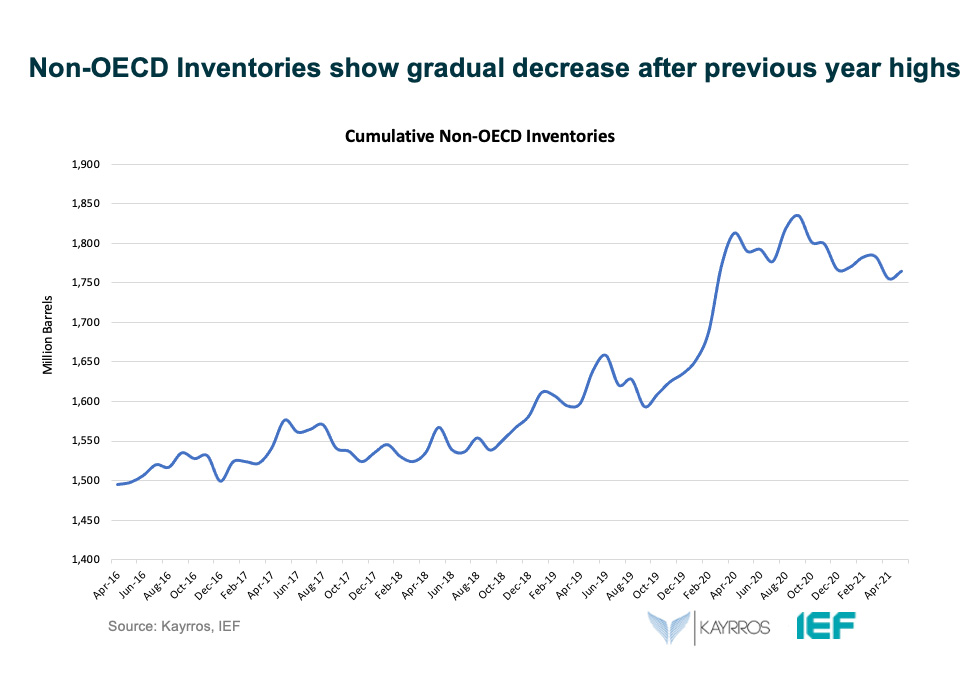
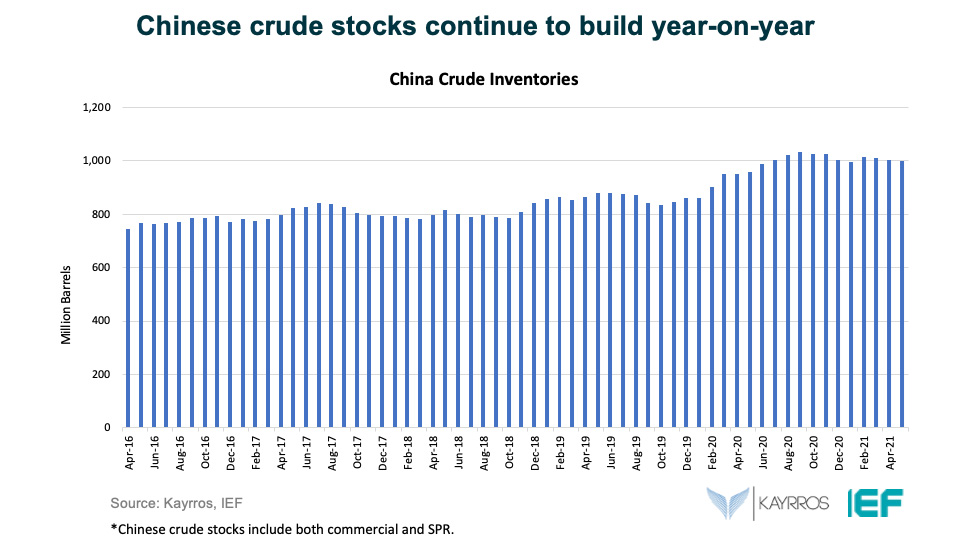
The slow pace of inventory change in May spanned most regions. Chinese crude oil inventories ended May about flat on the month, inching up by just 800,000 barrels (26 kb/d). So did those in the Middle East (+110,000 barrels, 4 kb/d). Small builds in Latin America (+4.68 million bbls, 161 kb/d), Asia Pacific (ex-China) (+2.91 million bbls, 94 kb/d), Sub-Saharan Africa (+2.56 million bbls, 83 kb/d) and Europe (2.31 million bbls, 75 kb/d) were partly offset by draws in North America (led by the US) and the Caribbean.
Compared to year-ago and 2019 levels, however, the regional contrasts couldn’t be more striking. The entire year-on-year overhang is concentrated in China, where stocks built for far longer than in any other country and remain a staggering 45 million bbls above year-ago levels, and 123 million bbls above 2019 levels. In contrast, stocks in the rest of the world are now down year-on-year and in some areas have even fallen below May 2019 levels. The largest yearly draws are in the US (-53 million bbls), Asia Pacific (-44 million bbs), and MENA ( 30 million bbls), followed by Europe, Latin America and the Caribbean.
In the world's largest oil markets, Other Asia, Europe and the US, stocks at end May were now significantly below their levels at the same time of year in 2019.
JODI Data:
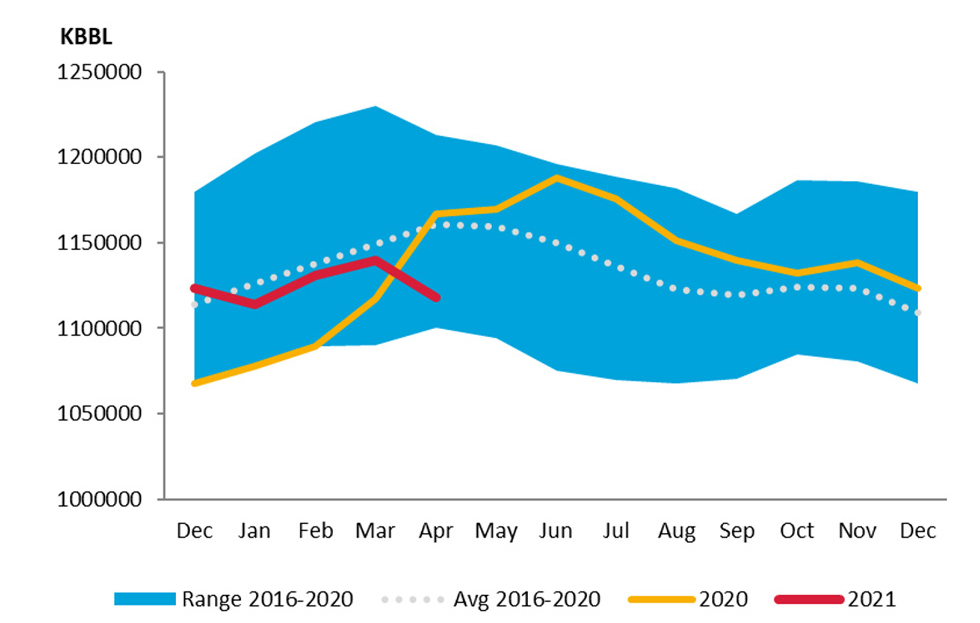
US crude oil closing stock levels in April fell m-o-m by 21.39 mb to 1118.28 mb.
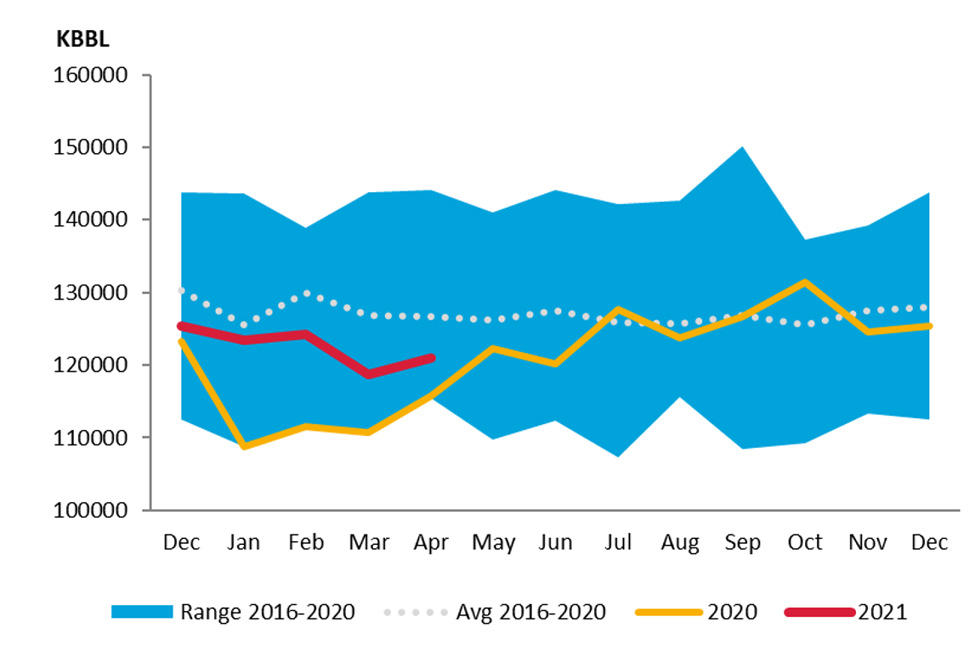
Korean crude oil closing stock levels in April rose m-o-m by 2.22 mb to 120.96 mb.
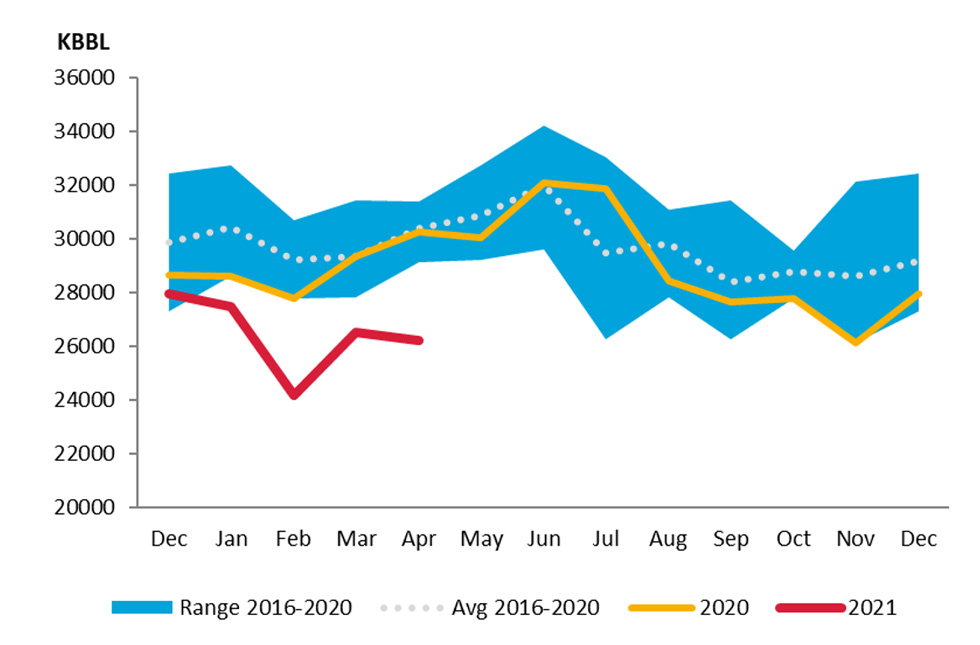
UK crude oil closing stock levels in April fell m-o-m by 288 kb to 26.22 mb.
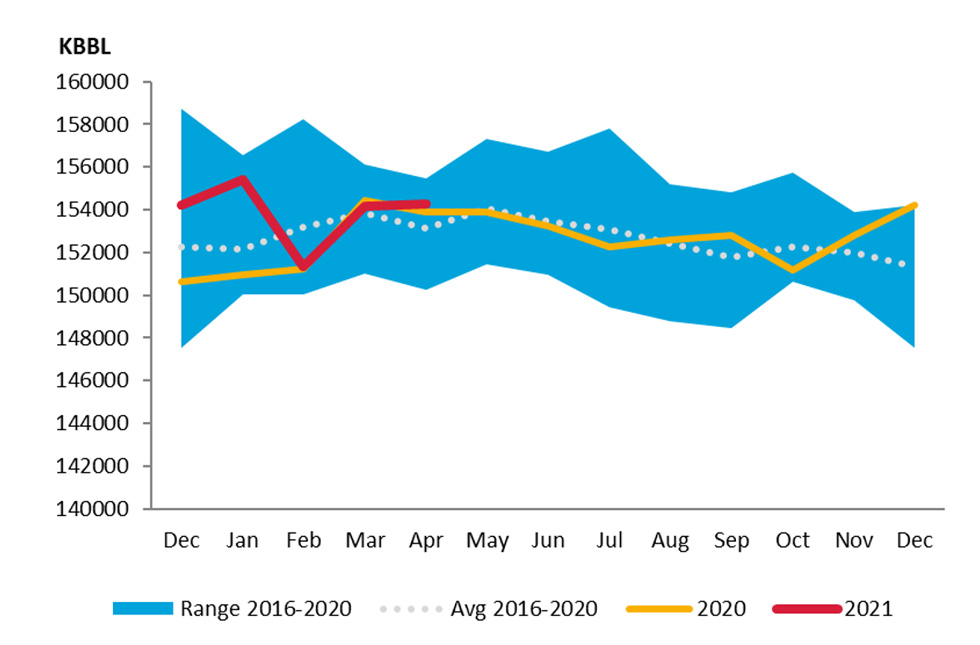
German crude oil closing stock levels in April fell m-o-m by 118 kb to 154.27 mb.
Explanatory Note
The IEF conducts a comprehensive comparative analysis of the short-, medium-, and long-term energy outlooks of the IEA OPEC, and the EIA to inform the IEA-IEF-OPEC Symposium on Energy Outlooks that the IEF hosts in Riyadh as part of the trilateral work programme on a yearly basis.
To inform IEF stakeholders on how perspectives on the oil market of both organisations evolve over time regularly, this monthly summary provides:
- An overview of key events and initiatives in the international policy and market context.
- Key findings and a snapshot overview of data points gained from comparing basic historical data and short-term forecasts of the IEA Oil Market Report and the OPEC Monthly Oil Market Report.
- A comparative analysis of oil inventory data reported by the IEA, OPEC, and EIA, and secondary sources in collaboration with Kayrros.
The International Energy Forum
The International Energy Forum is the leading global facilitator of dialogue between sovereign energy market participants. It incorporates members of International Energy Agency and the Organization of the Petroleum Exporting Countries, and also key players including China, India, Russia and South Africa. The forum's biennial ministerial meetings are the world's largest gathering of energy ministers, where discussions focus on global energy security and the transition towards a sustainable and inclusive energy future. The forum has a permanent secretariat of international staff based in the Diplomatic Quarter of Riyadh, Saudi Arabia. For more information visit www.ief.org.