")

Comparative Analysis of Monthly Reports on the Oil Market
1. International Policy and Market Context
Global Oil Balances to Tighten Further in Third Quarter
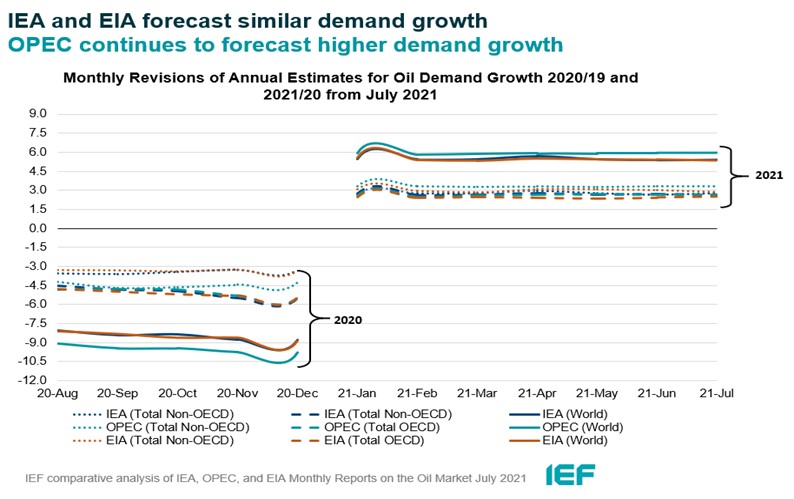
- Global oil demand is expected to rise between 5 mb/d and 6 mb/d in 2021 and between 3 mb/d and 4 mb/d in 2022 according to the IEA, OPEC, and EIA, respectively. Pending further OPEC+ supply adjustments, the third quarter of 2021 could see the largest crude inventory draw in at least a decade, tightening oil market balances significantly.
EU Unveils "Fit for 55" Climate Roadmap
- On 14 July, the European Commission the European Commission adopted a legislative package known as "Fit for 55" to align EU policy with the ambitious political mandates of the Green Deal and EU Climate Law. This includes lowering the European Emission Trading System cap faster and extending its coverage to the transport sector. It also includes introducing a carbon border adjustment tariff on selected imports into the EU to avoid 'carbon leakage' and encourage global policy cohesion.
China's National Carbon Market Begins Trading
- China's national carbon market, which will become the world's largest emissions trading system, began operations on 16 July 2021. In the initial stage, the first consignment of carbon emission allowances will be given to key companies in the electricity industry. About 2,200 companies with around 4 billion tonnes of carbon emissions will be included in the carbon trade market comprising 30 percent of China's total emissions.
Global Oil and Asian LNG Prices Climb to New Highs
- Upward price pressures on oil prices remain robust after OPEC agreed to leave production adjustments largely unchanged. Demand recovery outpaces non-OPEC supply growth with the US EIA increasing its Brent price forecast to $72 per barrel for the second half of 2021 and $67 per barrel for the year. Asian spot liquefied natural gas (LNG) prices spiked to a fresh eight-year seasonal high in early July to more than $14 MMBtu as demand remained robust globally for power generation needs in the summer. This is the highest spot price since 2013.
2. Key Points
2.1 Demand
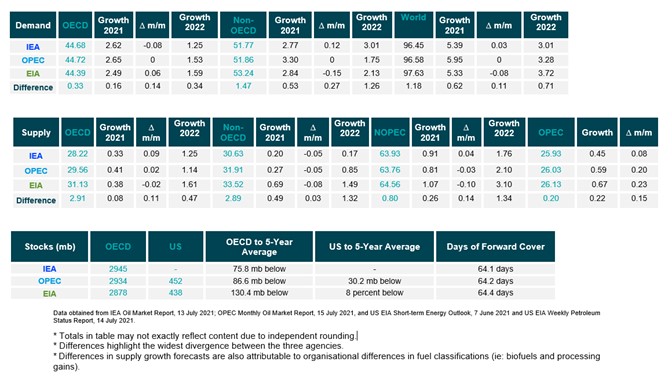
The IEA raised its 2021 oil demand growth assessment slightly while the EIA revised its estimate lower. OPEC's demand growth estimate remains unchanged for the fourth month in a row.
- The IEA increased its assessment of year-on-year (y-o-y) demand growth by 30 kb/d to 5.39 mb/d. Demand is expected to see further growth of 3.01 mb/d in 2022, the IEA reports.
- OPEC's y-o-y demand growth estimate remains the same as last month at 5.95 mb/d. OPEC forecasts demand growth at 3.28 mb/d in 2022.
- EIA's assessment of this year's demand growth fell by 80 kb/d to 5.33 mb/d and is pegged at 3.72 mb/d in 2022. The IEA, OPEC, and EIA estimates for absolute world demand are now 96.45 mb/d, 96.58 mb/d, and 97.63 mb/d for 2021, respectively.
The IEA and EIA converge on both OECD and non-OECD demand growth while OPEC's assessment remains static.
- The IEA's assessment of y-o-y non-OECD demand growth rose by 120 kb/d to 2.77 mb/d, while the EIA reports a decrease of 150 kb/d for overall growth of 2.84 mb/d. OPEC's non-OECD demand growth estimate remains the same as last month at 3.30 mb/d.
- The IEA's estimate for OECD demand fell by 80 kb/d to 2.62 mb/d for 2021. EIA's assessment sees growth at 2.49 mb/d y-o-y, an increase of 60 kb/d. OPEC OECD demand growth remains the same as last month at 2.65 mb/d.
- OPEC and EIA assessments of OECD demand growth differ by 0.16 mb/d, while OPEC and IEA assessments of non-OECD demand growth differ by 530 kb/d.
2.2 Supply
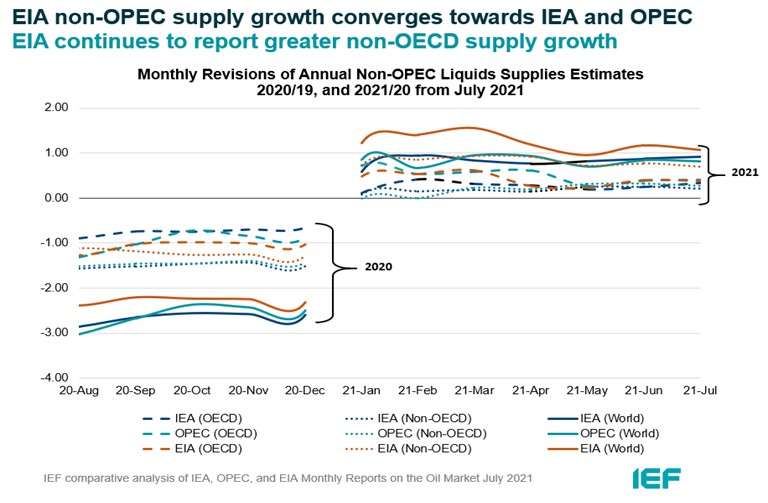
Non-OPEC supply growth assessments by the IEA and EIA begin to diverge while OPEC's estimate remains steady.
- The IEA's July assessment of non-OPEC supply rose by 40 kb/d for a total growth of 0.91 mb/d, while the EIA reports a higher overall supply growth of 1.07 mb/d y-o-y, down by 100 kb/d from last month's assessment. OPEC revised its non-OPEC supply growth estimate slightly by 30 kb/d to 0.81 mb/d. Non-OPEC supply growth is expected to increase into 2022 with the IEA reporting growth at 1.76 mb/d, OPEC at 2.10 mb/d, and EIA at 3.10 mb/d. In absolute values, the IEA, OPEC, and EIA estimate non-OPEC supply at 63.93 mb/d, 63.76 mb/d, and 64.56 mb/d, respectively for 2021.
- The IEA estimates OECD oil supply growth this year at 0.33 mb/d while OPEC pegs it at 0.41 mb/d, an increase of 90 kb/d and 20 kb/d, respectively. The EIA also trimmed its estimate by 20 kb/d for a growth of 0.38 mb/d. In absolute terms, the IEA, OPEC, and EIA estimate OECD oil supply at 28.22 mb/d, 29.56 mb/d, and 31.13 mb/d, respectively for 2021. The greatest divergence on OECD supply growth is between OPEC and IEA at 80 kb/d.
The EIA reports higher non-OECD supply growth than the IEA and OPEC.
- The IEA's non-OECD supply growth assessment is revised down by 50 kb/d to 0.20 mb/d. OPEC's forecast reports a growth of 0.27 mb/d for 2021, which is also revised down by 50 kb/d from last month. The EIA is substantially more optimistic for non-OECD supply growth, forecasting a rise of 0.69 mb/d, a figure that was revised down by 80 kb/d from last month. This divergence of estimates continues into 2022 with the EIA forecasting growth at 1.49 mb/d compared to the IEA and OPEC at 0.17 mb/d and 0.85 mb/d, respectively.
- In absolute values, the IEA, OPEC, and EIA non-OECD supply estimates are 30.63 mb/d, 31.91 mb/d, and 33.52 mb/d, respectively for 2021. Divergence on total non-OECD supply growth is widest between the IEA and EIA, differing by 490 kb/d.
The IEA, OPEC, and EIA revise OPEC production estimates upwards for June.
- The IEA revised its OPEC production estimate upward by 450 kb/d month-on-month (m-o-m) in June to reach total production of 25.93 mb/d. OPEC's assessment of its own production in June was revised upwards by 590 kb/d to 26.03 mb/d. The EIA also increased its assessment by 670 kb/d for total OPEC crude production of 26.13 mb/d in June.
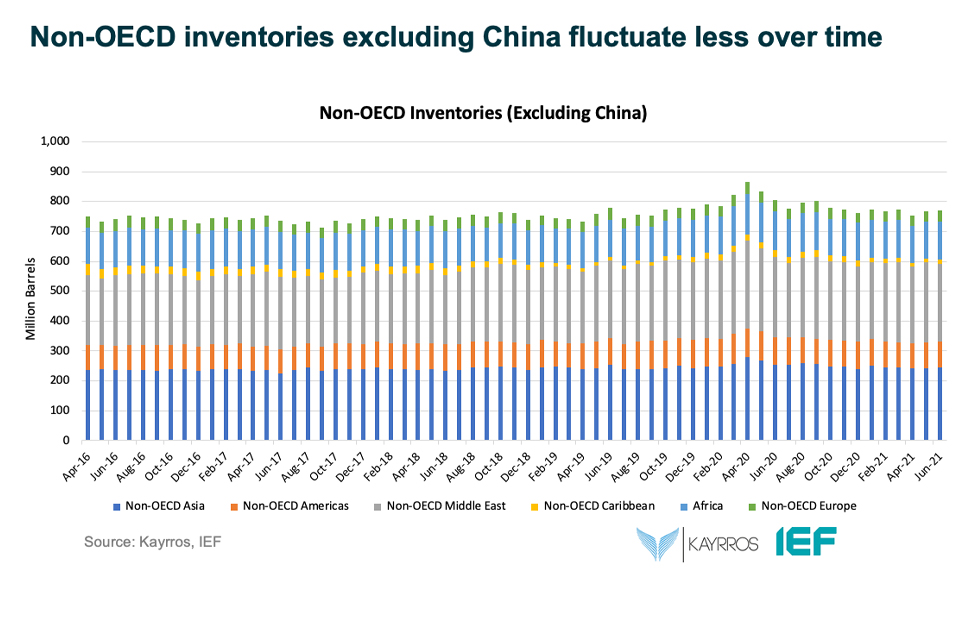
2.3 Stocks
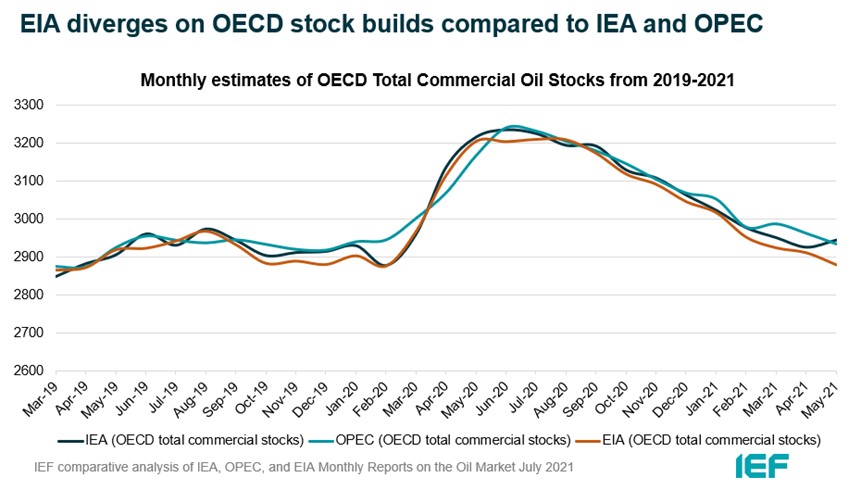
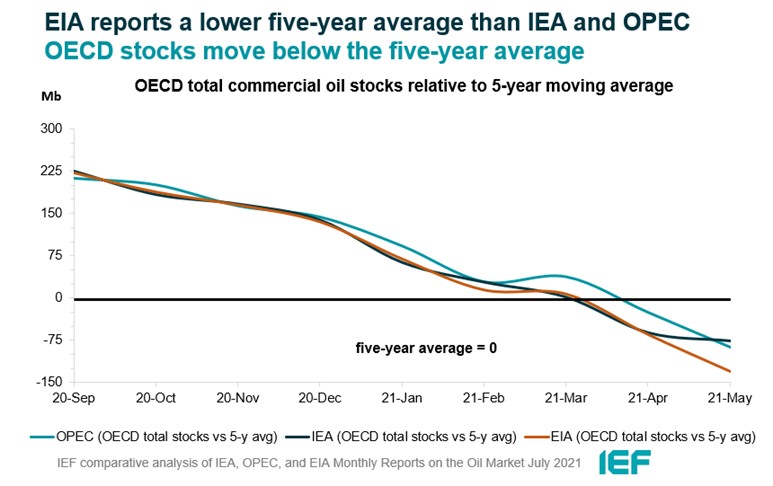
The IEA, OPEC, and EIA continue to display strong alignment on stock figures which are now below the five-year average.
- The IEA reports OECD stock levels at 2945 mb, which is close to OPEC's assessment of 2934 mb and EIA's assessment of 2878 mb which is 75.8 mb, 86.6 mb, and 130.4 mb below the five-year average, respectively.
- According to the IEA, crude oil inventories drew by 5.3 mb while product stocks built by 26 mb. Other oils, including NGLs and feedstocks drew by 2.6 mb. According to OPEC, crude oil stocks built by 1.1 mb while products built by 7.2 mb.
- EIA estimates OECD inventories dropped by 6 mb in May to 2878 mb – 130 mb below the five-year average.
- The widest divergence in inventories is between OPEC and the EIA which stands at 67 mb. Total US crude inventories (excluding SPR) amount to about 438 mb according to the EIA which are 8 percent below the five-year average for this time of year. OPEC reports US commercial crude oil stocks at about 452 mb and around 30 mb below the five-year average.
2.4 Snapshot (mb/d)
3. Global Analysis
3.1 Demand Data
3.2 Supply Data
3.3 Stock Data
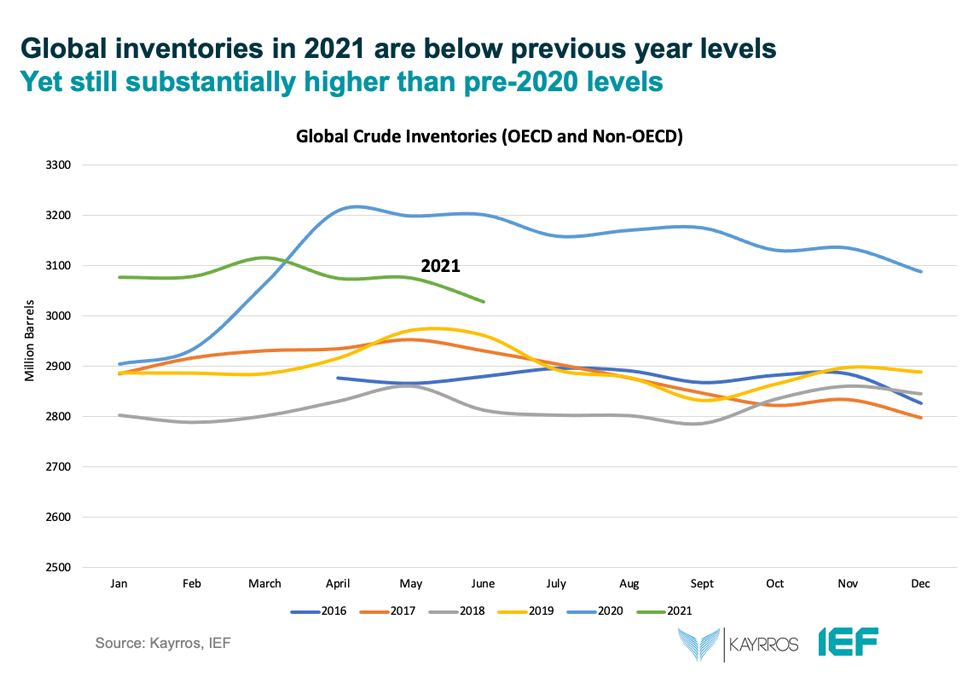
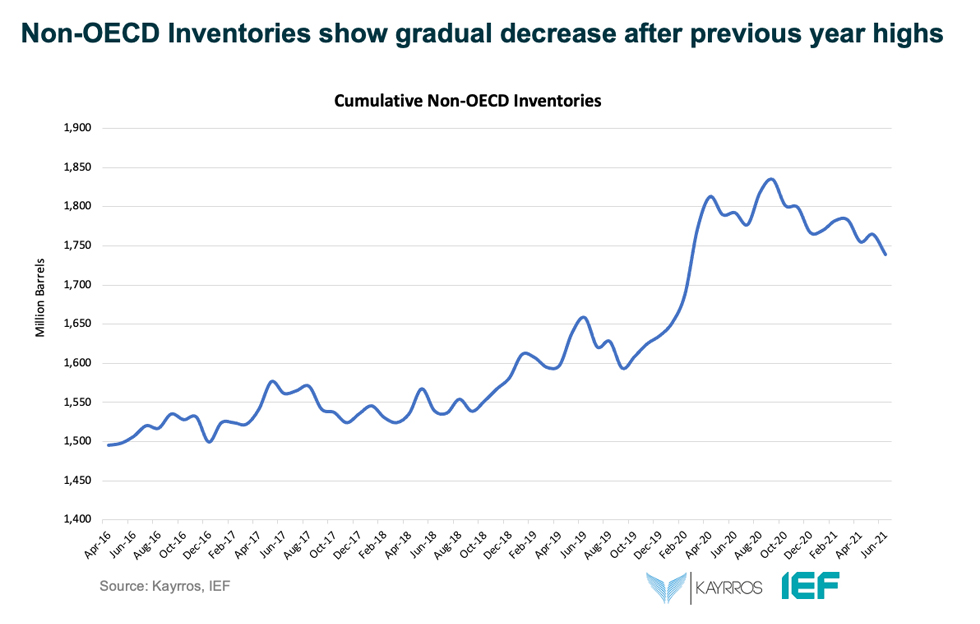
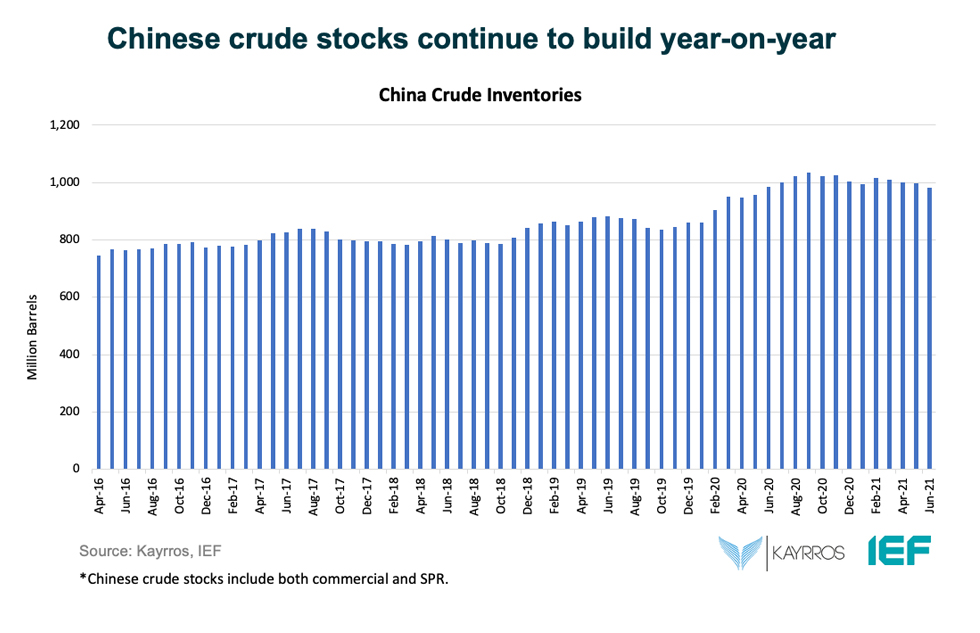
IEF-Kayrros Stock Analysis:
JODI Data:
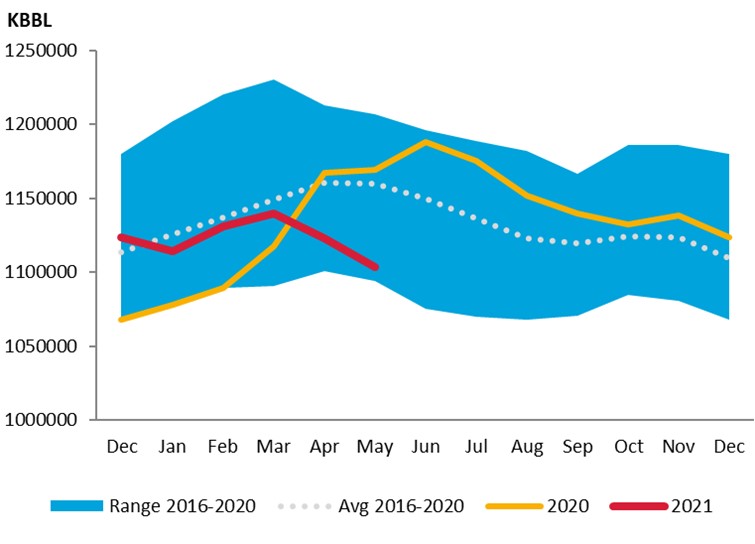
US crude oil closing stock levels in May fell m-o-m by 19.82 mb to 1103.34 mb.
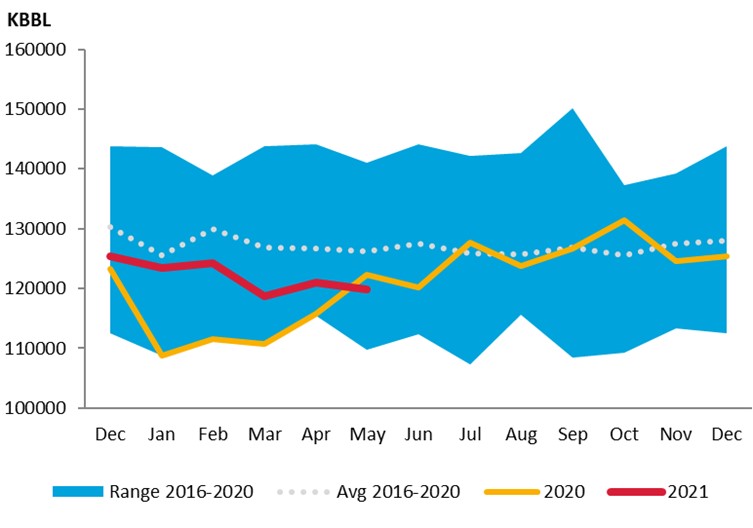
Korean crude oil closing stock levels in May fell m-o-m by 1.11 mb to 119.84 mb.
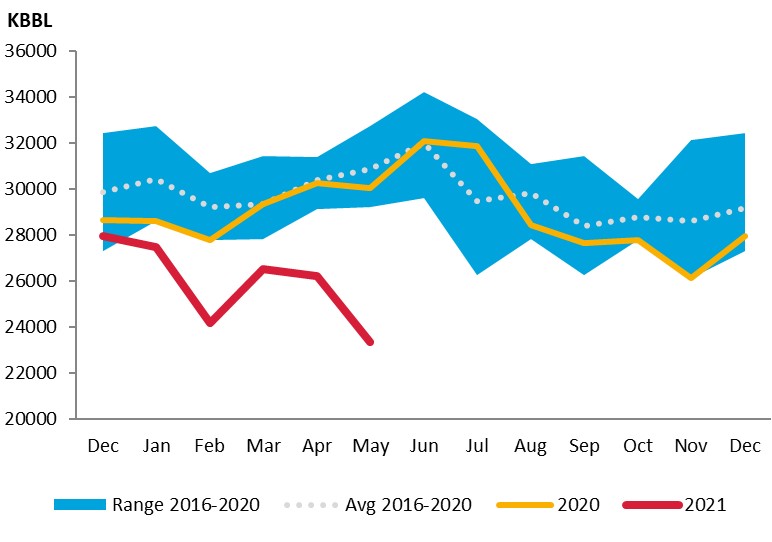
UK crude oil closing stock levels in May fell m-o-m by 2.89 mb to 23.33 mb.
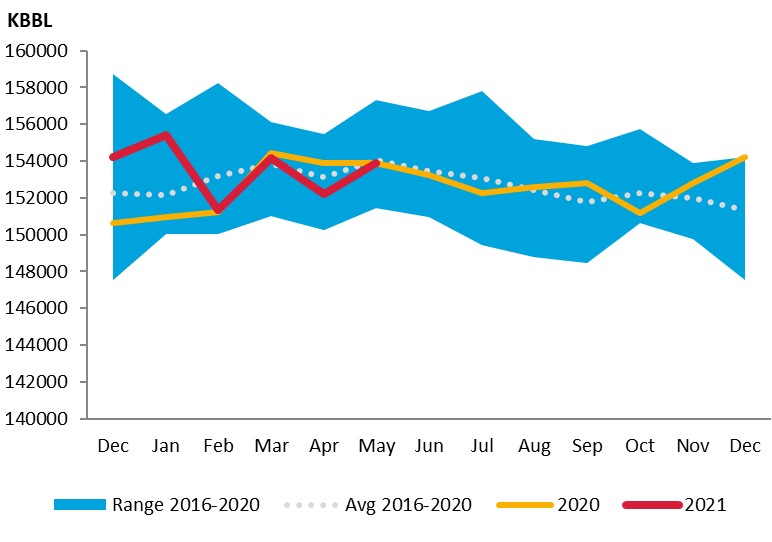
While its April figures were significantly revised downward, German crude oil closing stock levels in May rose m-o-m by 1.67 mb to 153.89 mb.
Explanatory Note
The IEF conducts a comprehensive comparative analysis of the short-, medium-, and long-term energy outlooks of the IEA OPEC, and the EIA to inform the IEA-IEF-OPEC Symposium on Energy Outlooks that the IEF hosts in Riyadh as part of the trilateral work programme on a yearly basis.
To inform IEF stakeholders on how perspectives on the oil market of both organisations evolve over time regularly, this monthly summary provides:
- An overview of key events and initiatives in the international policy and market context.
- Key findings and a snapshot overview of data points gained from comparing basic historical data and short-term forecasts of the IEA Oil Market Report and the OPEC Monthly Oil Market Report.
- A comparative analysis of oil inventory data reported by the IEA, OPEC, and EIA, and secondary sources in collaboration with Kayrros.
The International Energy Forum
The International Energy Forum is the leading global facilitator of dialogue between sovereign energy market participants. It incorporates members of International Energy Agency and the Organization of the Petroleum Exporting Countries, and also key players including China, India, Russia and South Africa. The forum's biennial ministerial meetings are the world's largest gathering of energy ministers, where discussions focus on global energy security and the transition towards a sustainable and inclusive energy future. The forum has a permanent secretariat of international staff based in the Diplomatic Quarter of Riyadh, Saudi Arabia. For more information visit www.ief.org.