")

Comparative Analysis of Monthly Reports on the Oil Market
1. International Policy and Market Context
Nord Stream 2 gas pipeline construction now complete
- Russia's gas company, Gazprom, announced the construction of the Nord Stream 2 pipeline was complete on 10 September. In late August, a German court rejected an appeal to allow the pipeline to be exempt from the EU's Gas Directive subjecting the line to EU energy market rules. Natural gas shipments can start this year, pending approvals and certifications from Germany's energy regulator.
Costs of electricity and natural gas surge across Europe
- Consumers in Europe are facing higher energy prices as wholesale electricity costs surpassed their highest ever level on 6 September. The main causes for the price spikes include lower than expected wind generation, low natural gas storage levels, and poor interconnections in combination with greater competition with Asia for LNG shipments.
20th OPEC and non-OPEC Meeting reaffirms production adjustments
- On 1 September, OPEC and non-OPEC countries reconfirmed the production adjustment plan and the monthly production adjustment mechanism approved at the 19th Meeting and the decision to adjust upward the monthly overall production by 400 kb/d for the month of October 2021. The 21st OPEC and non-OPEC Ministerial Meeting is scheduled for 4 October 2021.
Hurricane Ida leaves a million without power and disrupts US Gulf Coast production
- The category 4 hurricane was the strongest to hit the US mainland in 16 years when it made landfall on 29 August. Ida severely damaged critical infrastructure and left a million people without power in Louisiana. About 90 percent of oil and 85 percent of natural gas production shut down on the US Gulf Coast. More than a week after the landfall, outage stood at ~1 mb/d with a cumulative loss of ~20 million barrels.
2. Key Points
2.1 Demand
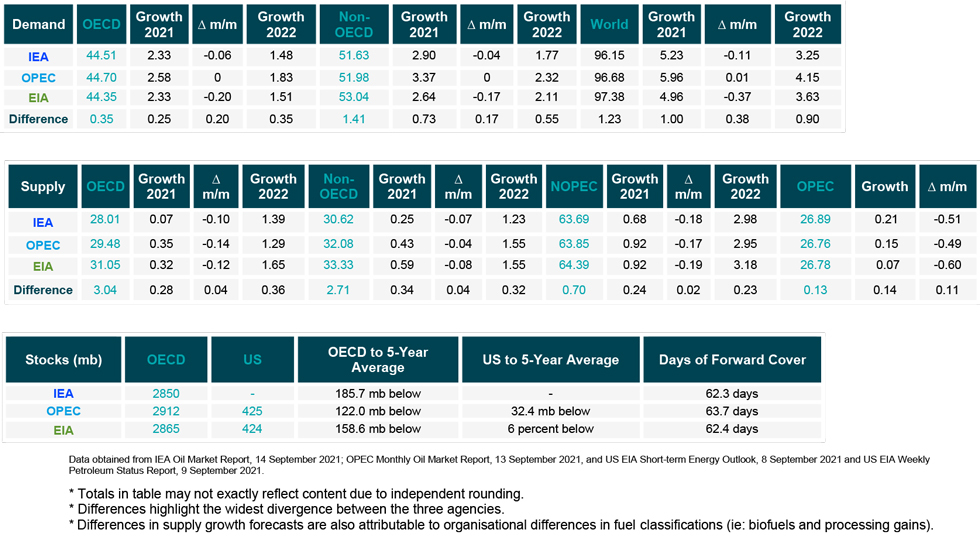
The IEA and EIA lowers 2021 oil demand growth assessments while OPEC's demand growth increases slightly after five months.
- The IEA's assessment of y-o-y non-OECD demand growth fell by 40 kb/d to 2.90 mb/d, while the EIA makes a downwards revision of 170 kb/d for overall growth of 2.64 mb/d. OPEC's non-OECD demand growth remains the same as last month at 3.37 mb/d.
- The IEA's estimate for OECD demand fell by 60 kb/d to 2.33 mb/d for 2021. EIA also sees growth at the same level, its estimate revised down by 200 kb/d. OPEC OECD demand growth forecast remains unchanged at 2.58 mb/d.
- OPEC and IEA/EIA assessments of OECD demand growth differ by 250 kb/d, while OPEC and EIA estimates of non-OECD demand growth differ by 730 kb/d.
2.2 Supply
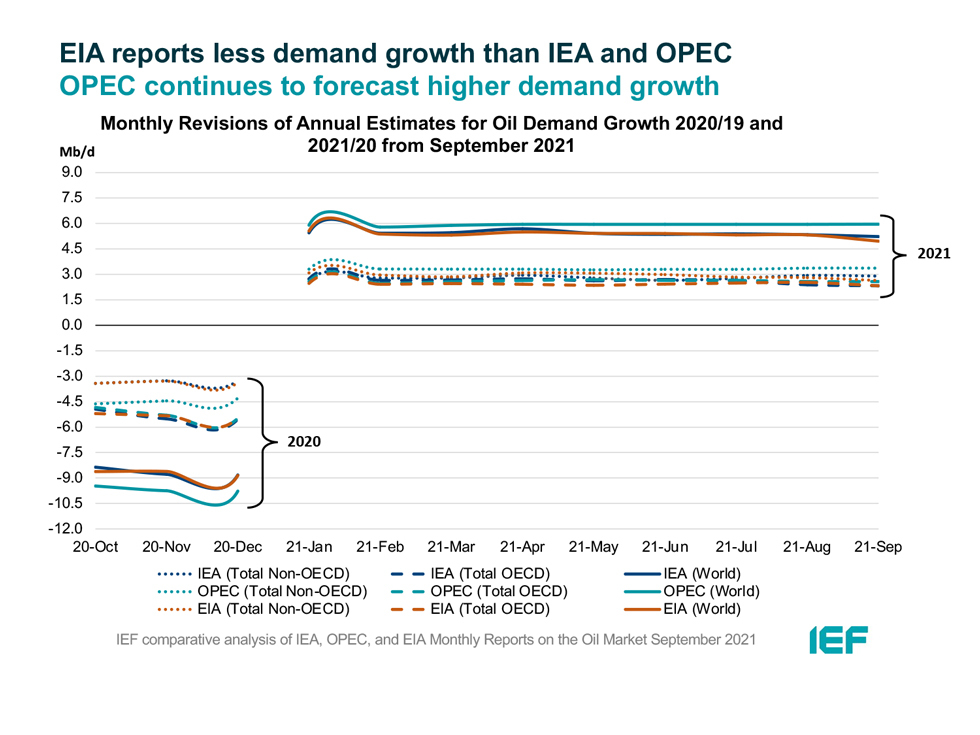
OPEC and EIA report the same non-OPEC supply growth while the IEA's estimate is revised down further.
- The IEA's September assessment of non-OPEC supply fell by 180 kb/d for a total growth of 0.68 mb/d, while the EIA reports a higher overall supply growth of 0.92 mb/d y-o-y, revised down by 190 kb/d from last month. OPEC revised its non-OPEC supply growth estimate down by 170 kb/d to 0.92 mb/d as well. Non-OPEC supply growth is expected to increase into 2022 with the IEA reporting growth at 2.98 mb/d, OPEC at 2.95 mb/d, and EIA at 3.18 mb/d. In absolute values, the IEA, OPEC, and EIA estimate non-OPEC supply at 63.69 mb/d, 63.85 mb/d, and 64.39 mb/d, respectively for 2021.
- The IEA estimates OECD oil supply growth this year at 0.07 mb/d while OPEC pegs it at 0.35 mb/d, a decrease of 100 kb/d and 140 kb/d, respectively. The EIA also lowered its estimate by 120 kb/d for a growth of 0.32 mb/d. In absolute terms, the IEA, OPEC, and EIA estimate OECD oil supply at 28.01 mb/d, 29.48 mb/d, and 31.05 mb/d, respectively for 2021. The greatest divergence on OECD supply growth is between IEA and EIA at 3.04 mb/d.
The EIA reports higher non-OECD supply growth than the IEA and OPEC.
- The IEA's non-OECD supply growth assessment is revised down by 70 kb/d to 0.25 mb/d. OPEC's forecast reports a growth of 0.43 mb/d for 2021, which is revised down by 40 kb/d from last month. The EIA is more optimistic for non-OECD supply growth, forecasting a rise of 0.59 mb/d, a figure that was revised down by 80 kb/d from last month. OPEC and EIA report higher growth in 2022 at 1.55 mb/d while the IEA forecasts growth at 1.23 mb/d.
- In absolute values, the IEA, OPEC, and EIA non-OECD supply estimates are 30.62 mb/d, 32.08 mb/d, and 33.33 mb/d, respectively for 2021. Divergence on total non-OECD supply growth is widest between the IEA and EIA, differing by 2.71 mb/d.
The IEA, OPEC, and EIA revise OPEC production estimates upwards for August.
- The IEA revised its OPEC production estimate upward by 210 kb/d month-on-month (m-o-m) to reach total production of 26.89 mb/d. OPEC's assessment of its own production was revised upwards by 150 kb/d to 26.76 mb/d. The EIA also increased its assessment by 70 kb/d for total OPEC crude production of 26.78 mb/d.
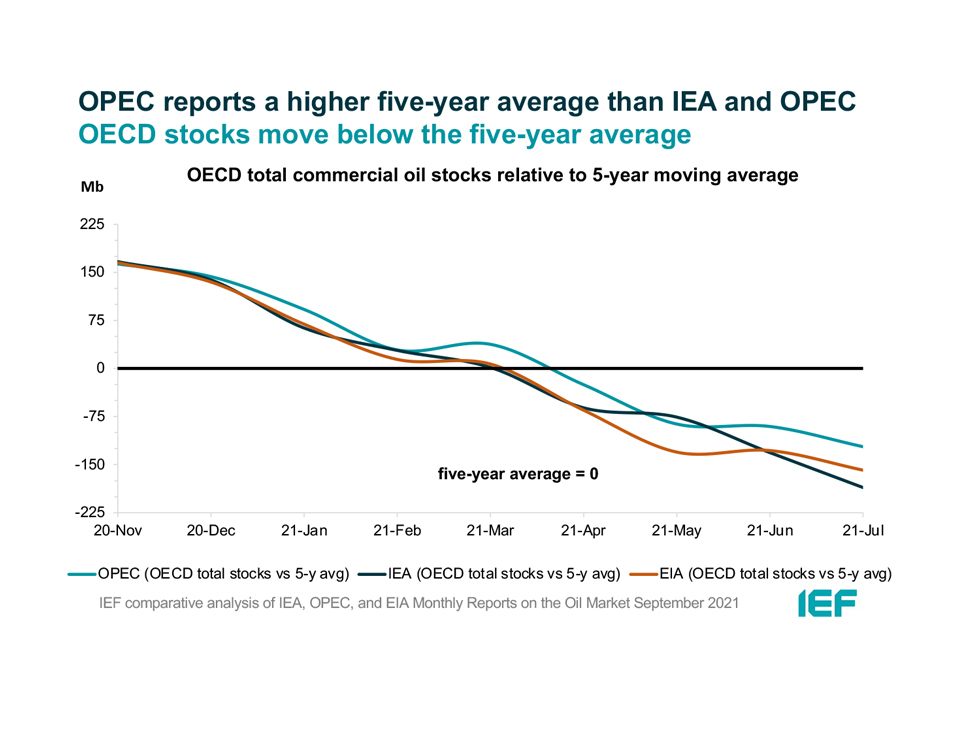
2.3 Stocks
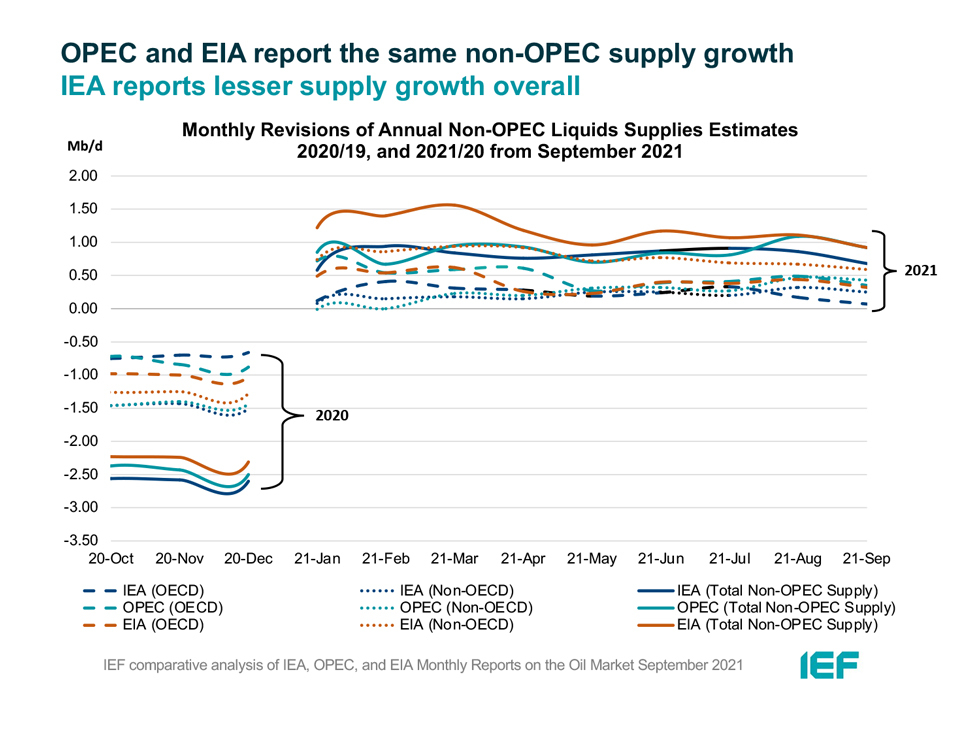
The IEA, OPEC, and EIA continue to display strong alignment on stock figures which are now below the five-year average but still higher than 60 days forward cover.
- The IEA reports OECD stock levels at 2850 mb, which is close to OPEC's assessment of 2912 mb and EIA's assessment of 2865 mb which is 185.7 mb, 122 mb, and 158.6 mb below the five-year average, respectively.
- According to the IEA, crude oil inventories drew by 14.8 mb while product stocks drew by 16.1 mb. Other oils, including NGLs and feedstocks drew by 3.6 mb. According to OPEC, crude oil stocks drew by 5.6 mb while products built by 16.1 mb.
- EIA estimates OECD inventories dropped by 8 mb in July to 2865 mb – 158.6 mb below the five-year average.
- The widest divergence in inventories is between OPEC and the IEA which stands at 62 mb. Total US crude inventories (excluding SPR) amount to about 424 mb according to the EIA which are 6 percent below the five-year average for this time of year. OPEC reports US commercial crude oil stocks at about 425 mb and around 32 mb below the five-year average.
2.4 Snapshot (mb/d)
3. Global Analysis
3.1 Demand Data
3.2 Supply Data
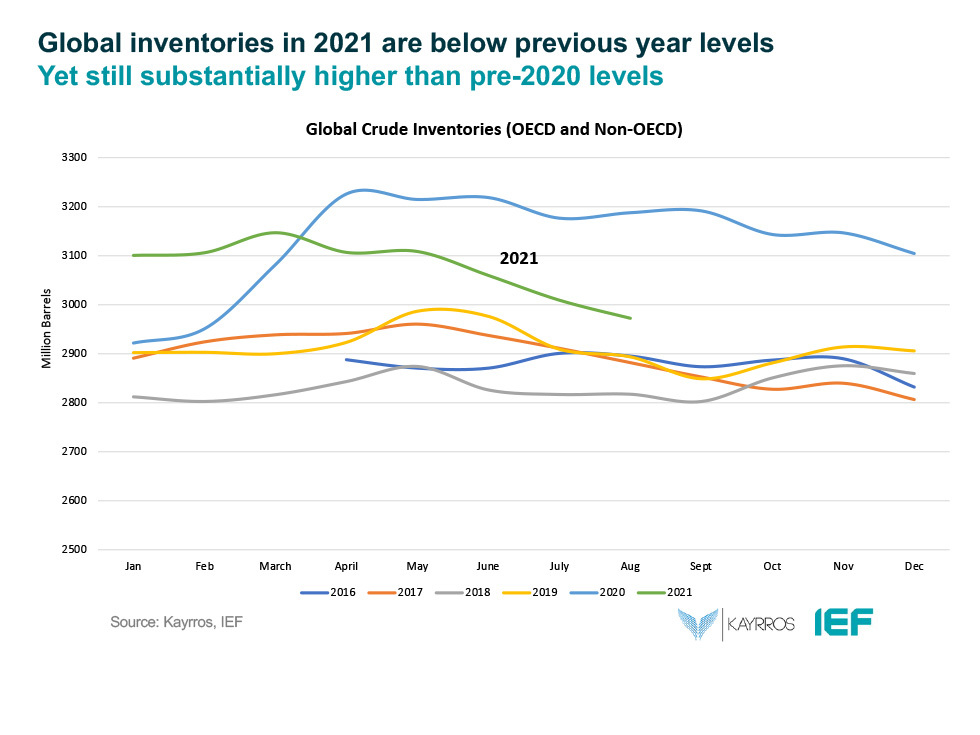
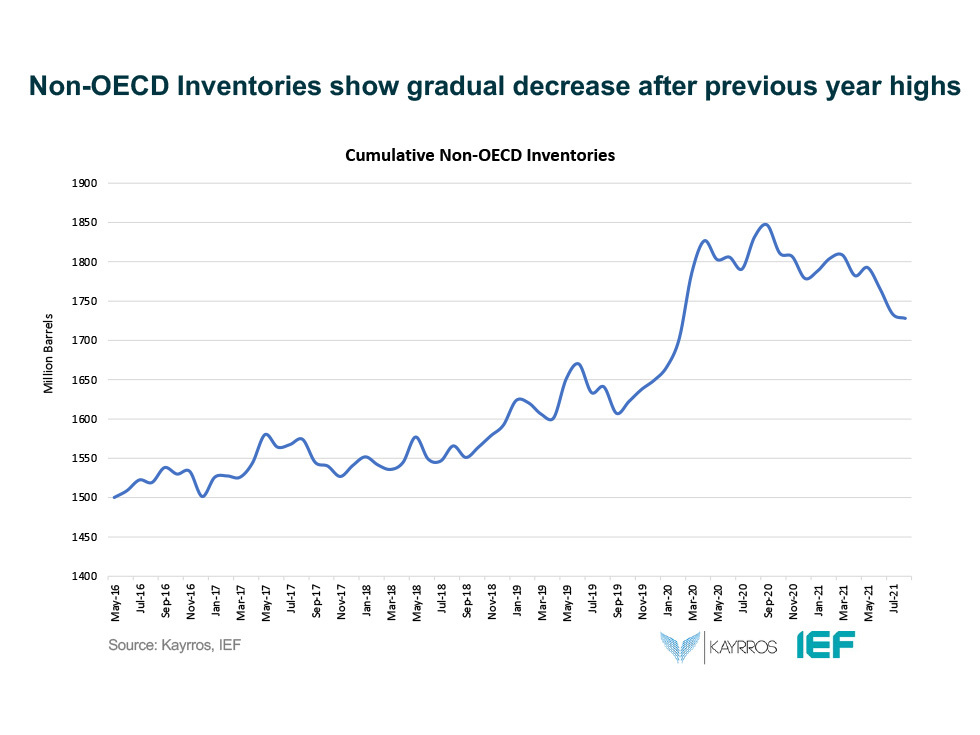
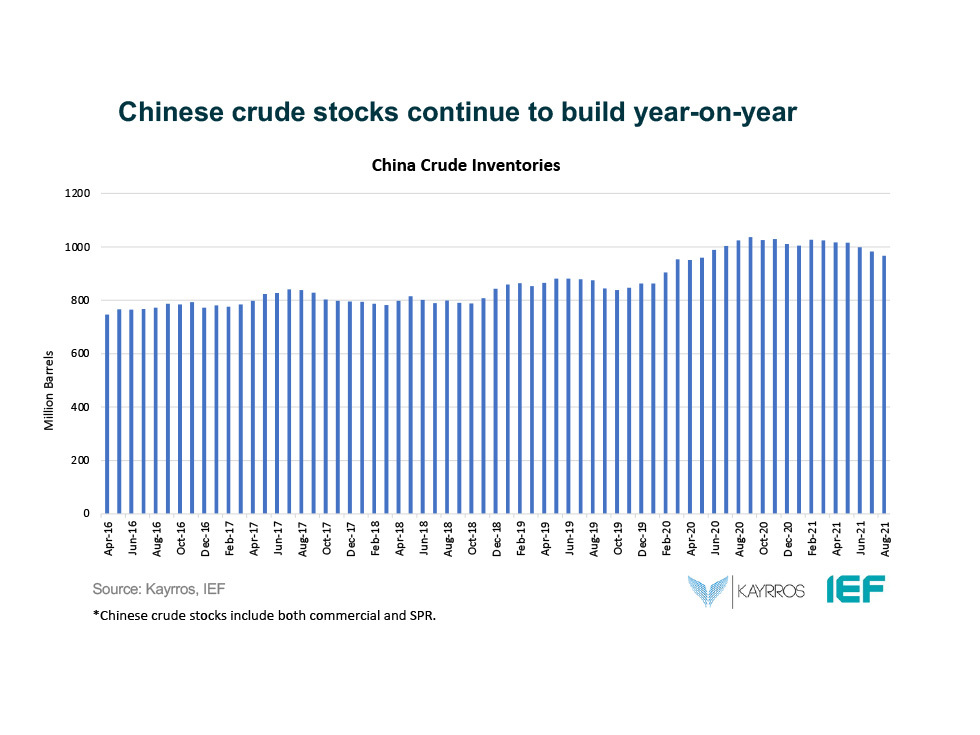
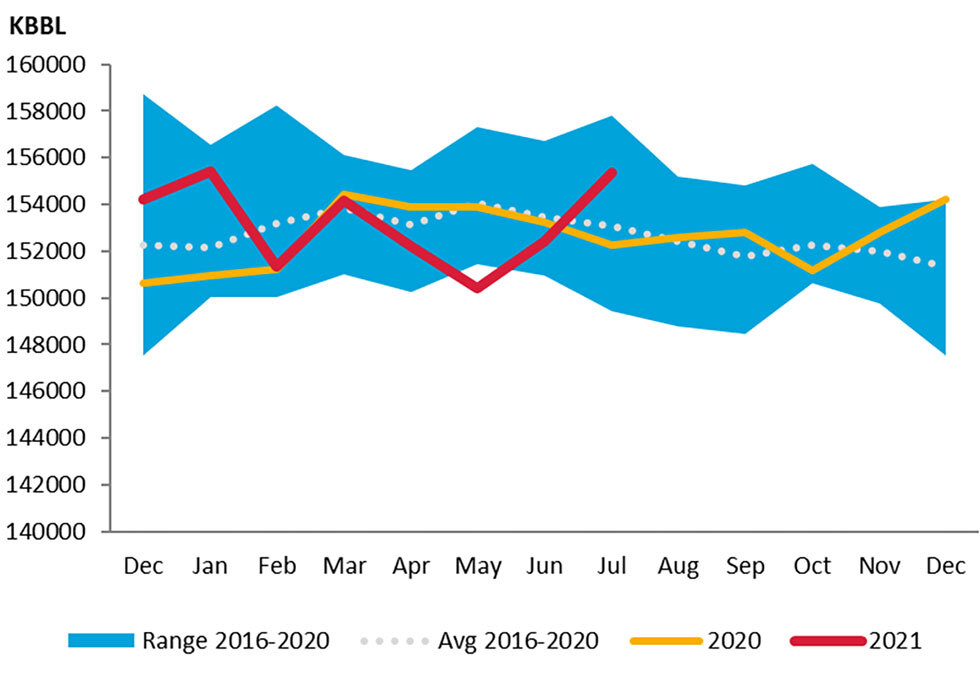
3.3 Stock Data
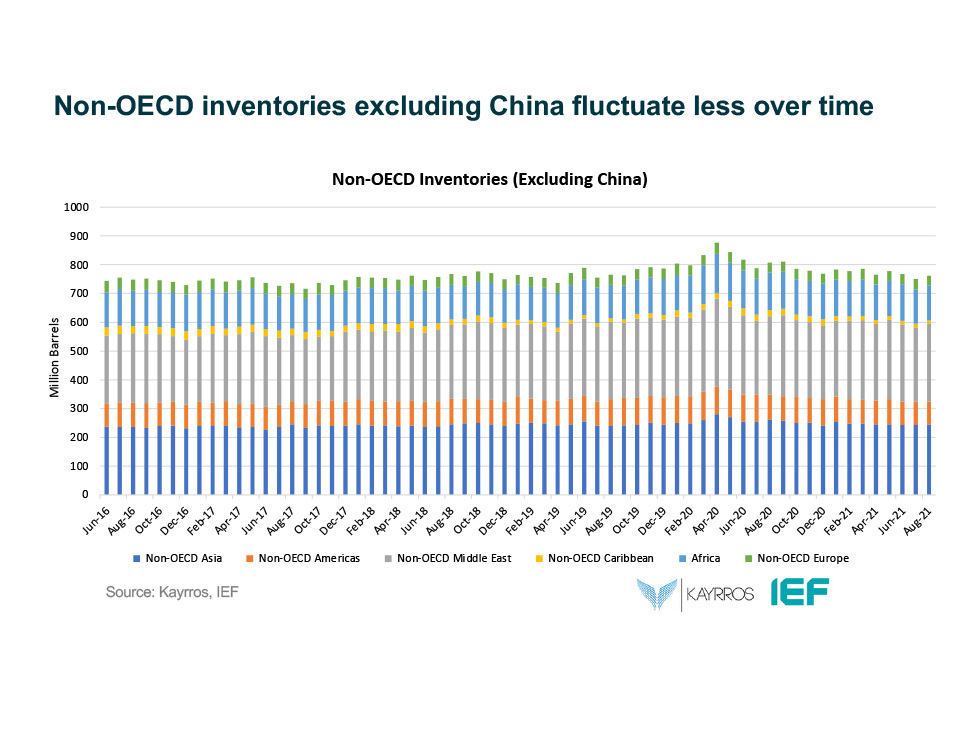
IEF-Kayrros Stock Analysis:
JODI Data:
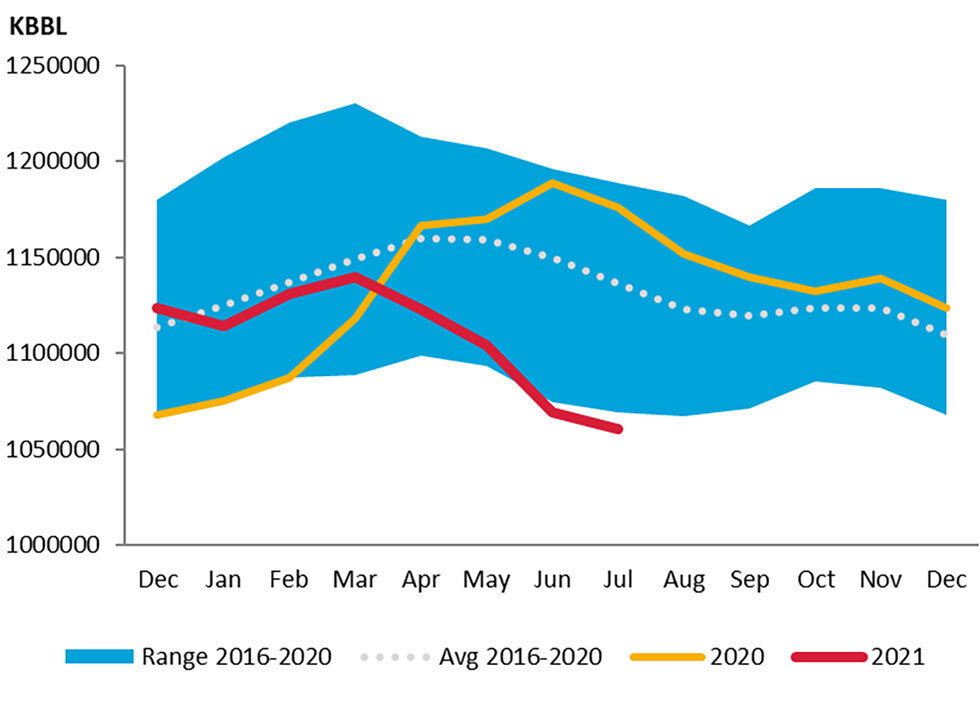
US crude oil closing stock levels in July fell m-o-m by 8.85 mb to an 80-month low of 1060.40 mb.
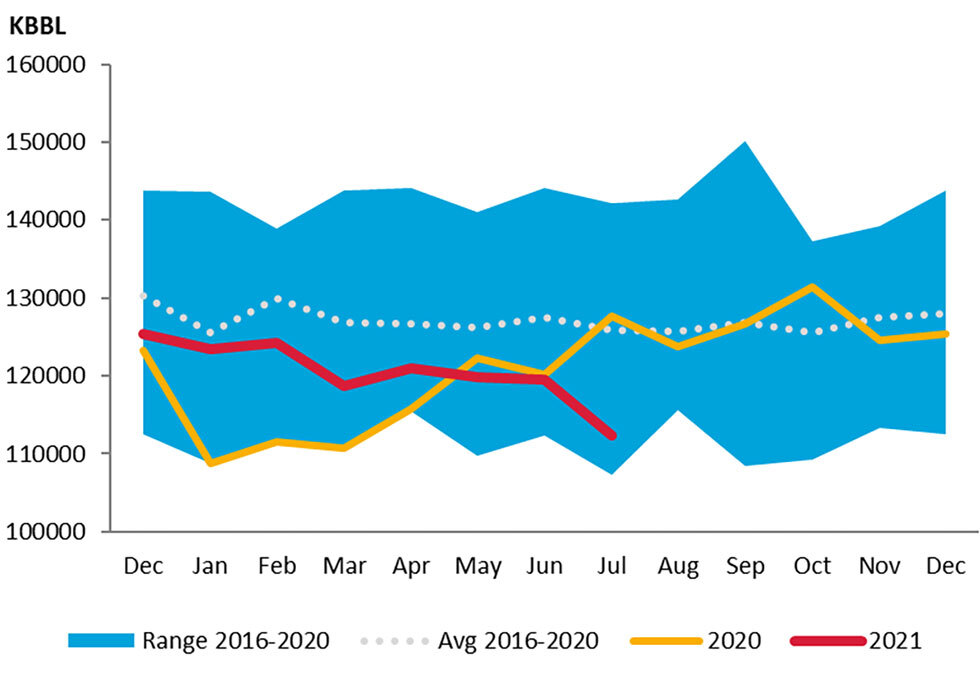
Korean crude oil closing stock levels in July fell m-o-m by 7.11 kb to 112.42 mb.
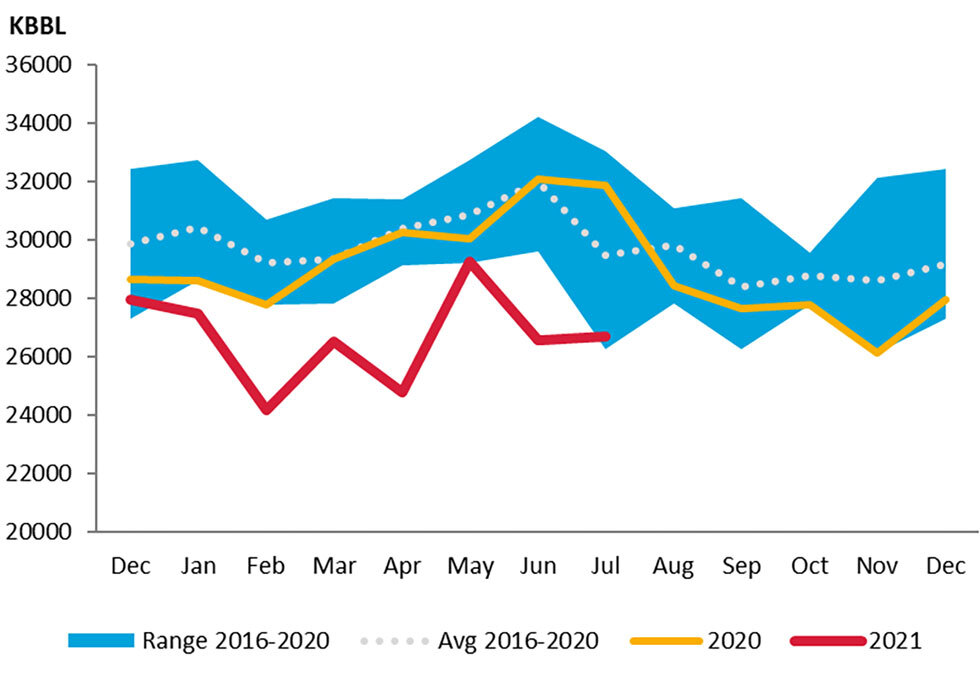
UK crude oil closing stock levels in July rose m-o-m by 118 kb to 26.67 mb.
While its June figures were significantly revised downward, German crude oil closing stock levels in July rose month-on-month by 2.91 mb to 155.35 mb.
Explanatory Note
The IEF conducts a comprehensive comparative analysis of the short-, medium-, and long-term energy outlooks of the IEA OPEC, and the EIA to inform the IEA-IEF-OPEC Symposium on Energy Outlooks that the IEF hosts in Riyadh as part of the trilateral work programme on a yearly basis.
To inform IEF stakeholders on how perspectives on the oil market of both organisations evolve over time regularly, this monthly summary provides:
- An overview of key events and initiatives in the international policy and market context.
- Key findings and a snapshot overview of data points gained from comparing basic historical data and short-term forecasts of the IEA Oil Market Report, the OPEC Monthly Oil Market Report, and the EIA Short-term Energy Outlook.
- A comparative analysis of oil inventory data reported by the IEA, OPEC, and EIA, and secondary sources in collaboration with Kayrros (added in an updated report on the IEF website).
The International Energy Forum
The International Energy Forum is the leading global facilitator of dialogue between sovereign energy market participants. It incorporates members of International Energy Agency and the Organization of the Petroleum Exporting Countries, and also key players including China, India, Russia and South Africa. The forum's biennial ministerial meetings are the world's largest gathering of energy ministers, where discussions focus on global energy security and the transition towards a sustainable and inclusive energy future. The forum has a permanent secretariat of international staff based in the Diplomatic Quarter of Riyadh, Saudi Arabia. For more information visit www.ief.org.