")

Comparative Analysis of Monthly Reports on the Oil Market
1. International Policy and Market Context
Cost of energy rises around the world
- Several factors including a robust return of pent-up demand, underinvestment in fossil fuels and weak renewable supplies have seen prices of oil, natural gas, coal, and electricity surge. The US WTI benchmark crossed $80 a barrel for the first time since 2014 and natural gas benchmarks including the UK NBP, Dutch TTF and Asia's JKM all reached all-time highs. US month-ahead natural gas prices more than tripled to reach their highest level since 2008 prior to the shale gas revolution.
More than 30 countries join pledge to cut methane emissions by 30 percent
- US President Joe Biden announced an agreement with the EU to reduce methane emissions at a Meeting of the Major Economies on Energy and Climate on 17 September. Since then, 24 new signatories have joined the Global Methane Pledge which now includes nine of the top 20 emitters, covers 60 percent of global GDP, and accounts for 30 percent of global methane emissions. The IEF Methane Measurement Methodology Initiative provides an important methodology to implement this pledge.
Upgraded Canadian oil pipeline begins operations
- Enbridge Inc. started delivering crude via its new Line 3 crude pipeline on 1 October. The replacement of Line 3 is expected to add about 370,000 additional barrels per day of crude oil export capacity from Western Canada to refineries in the US Midwest. The additional barrels from Canada to U.S. refiners partially offset shrinking imports from South America and the loss of about 30 million barrels of Gulf of Mexico production after Hurricane Ida.
21st OPEC and non-OPEC Meeting reaffirms production adjustments
- On 4 October, OPEC and non-OPEC countries reconfirmed the production adjustment plan and the monthly production adjustment mechanism approved at the 19th OPEC and non-OPEC Ministerial Meeting and the decision to adjust upward the monthly overall production by 0.4 mb/d for the month of November 2021. The 22nd OPEC and non-OPEC Ministerial Meeting is scheduled for 4 November 2021.
2. Key Points
2.1 Demand
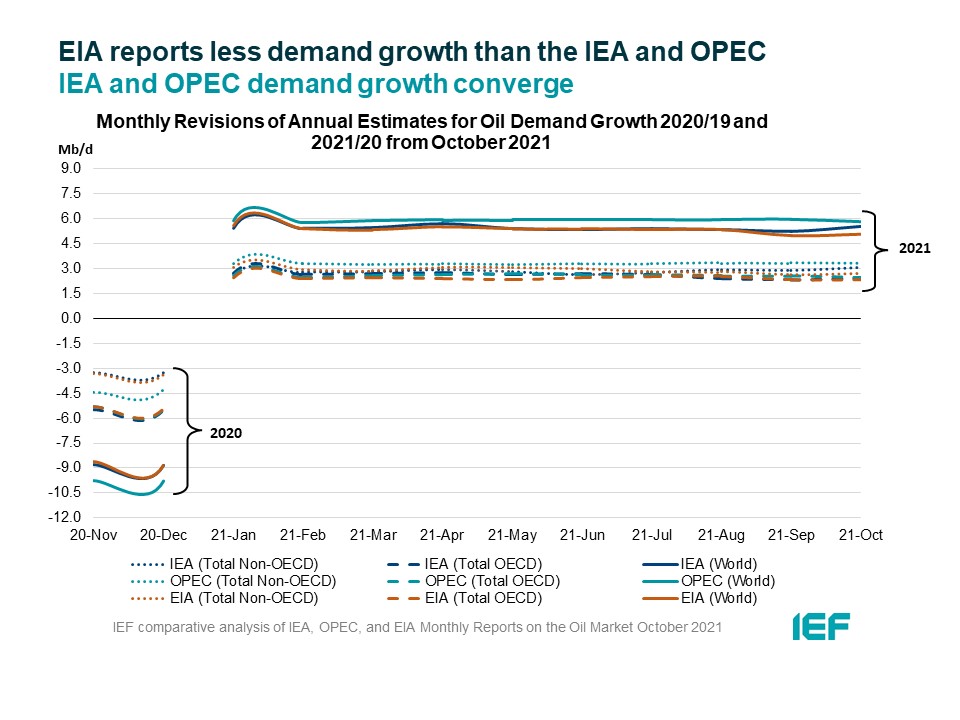
The IEA and EIA raise 2021 oil demand growth assessments while OPEC's falls.
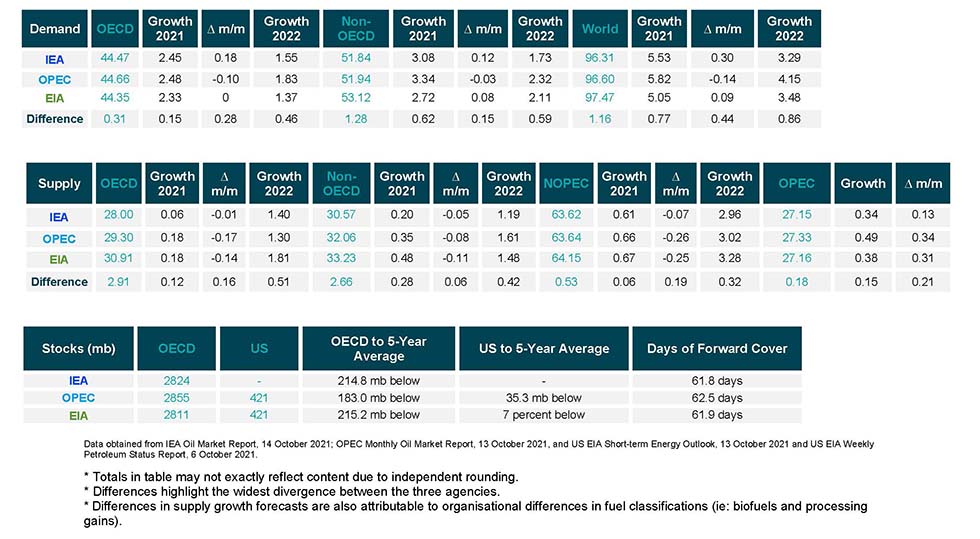
- The IEA's demand growth assessment rises year-on-year (y-o-y) by 300 kb/d to 5.53 mb/d for 2021. Demand is expected to grow by 3.29 mb/d in 2022, the IEA reports.
- OPEC's y-o-y demand growth estimate falls by 140 kb/d to 5.82 mb/d this year. Next year it forecasts a growth of 4.15 mb/d.
- EIA's assessment rises by 90 kb/d for a growth of 5.05 mb/d this year and it sees growth of 3.48 mb/d in 2022. The IEA, OPEC, and EIA estimates for absolute world demand are now 96.31 mb/d, 96.60 mb/d, and 97.47 mb/d for 2021, respectively.
The EIA and the IEA report higher OECD and non-OECD demand growth in 2021 while OPEC growth falls.
- The IEA's assessment of y-o-y non-OECD demand growth rises by 120 kb/d to 3.08 mb/d, while the EIA also makes an upward revision of 80 kb/d for overall growth of 2.72 mb/d. OPEC's non-OECD demand growth falls by 30 kb/d for a growth of 3.34 mb/d.
- The IEA's estimate for OECD demand rises by 180 kb/d to 2.45 mb/d for 2021. EIA OECD growth remains unchanged at 2.33 mb/d. OPEC OECD demand growth forecast falls by 100 kb/d for a growth of 2.48 mb/d.
- OPEC and EIA assessments of OECD demand growth differ by 150 kb/d, while OPEC and EIA estimates of non-OECD demand growth differ by 620 kb/d.
2.2 Supply
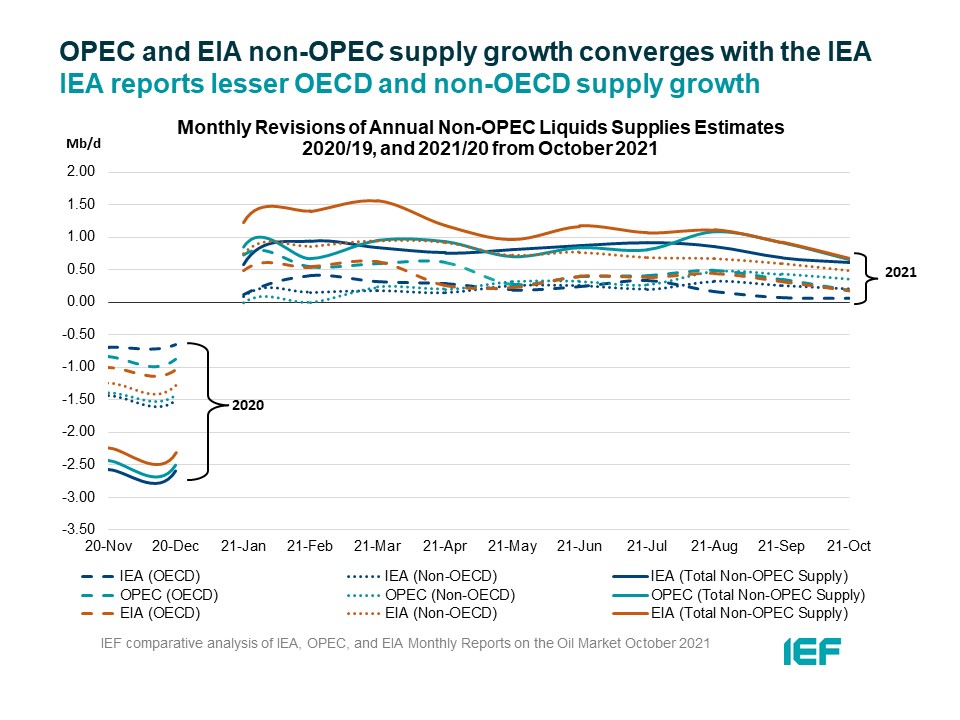
The IEA, OPEC and EIA make downward revisions on non-OPEC supply growth and converge to the closest point this year.
- The IEA's October assessment of non-OPEC supply fell by 70 kb/d for a total growth of 0.61 mb/d, while the EIA reports a slightly higher overall supply growth of 0.67 mb/d y-o-y, revised down by 250 kb/d from last month. OPEC revised its non-OPEC supply growth estimate down by 260 kb/d to 0.66 mb/d. Non-OPEC supply growth is expected to increase into 2022 with the IEA reporting growth at 2.96 mb/d, OPEC at 3.02 mb/d, and EIA at 3.28 mb/d. In absolute values, the IEA, OPEC, and EIA estimate non-OPEC supply at 63.62 mb/d, 63.64 mb/d, and 64.15 mb/d, respectively for 2021.
- The IEA estimates OECD oil supply growth this year at 0.06 mb/d while OPEC pegs it at 0.18 mb/d, a decrease of 10 kb/d and 170 kb/d, respectively. The EIA also lowered its estimate by 140 kb/d for a growth of 0.18 mb/d. In absolute terms, the IEA, OPEC, and EIA estimate OECD oil supply at 28.00 mb/d, 29.30 mb/d, and 30.91 mb/d, respectively for 2021. The difference between OPEC/EIA and IEA OECD supply growth is 120 kb/d.
The EIA reports higher non-OECD supply growth than the IEA and OPEC.
- The IEA's non-OECD supply growth assessment is revised down by 50 kb/d to 0.20 mb/d. OPEC's forecast reports a growth of 0.35 mb/d for 2021, which is revised down by 80 kb/d from last month. The EIA is more optimistic for non-OECD supply growth, forecasting a rise of 0.48 mb/d, a figure that was revised down by 110 kb/d from last month. OPEC and EIA report higher growth in 2022 at 1.61 mb/d and 1.48, respectively while the IEA forecasts growth at 1.19 mb/d.
- In absolute values, the IEA, OPEC, and EIA non-OECD supply estimates are 30.57 mb/d, 32.06 mb/d, and 33.23 mb/d, respectively for 2021. Divergence on total non-OECD supply growth is widest between the IEA and EIA, differing by 280 kb/d.
The IEA, OPEC, and EIA revise OPEC production estimates upwards for September.
- The IEA revised its OPEC production estimate upward by 340 kb/d month-on-month (m-o-m) to reach total production of 27.15 mb/d. OPEC's assessment of its own production was revised upwards by 490 kb/d to 27.33 mb/d. The EIA also increased its assessment by 380 kb/d for total OPEC crude production of 27.16 mb/d.
2.3 Stocks
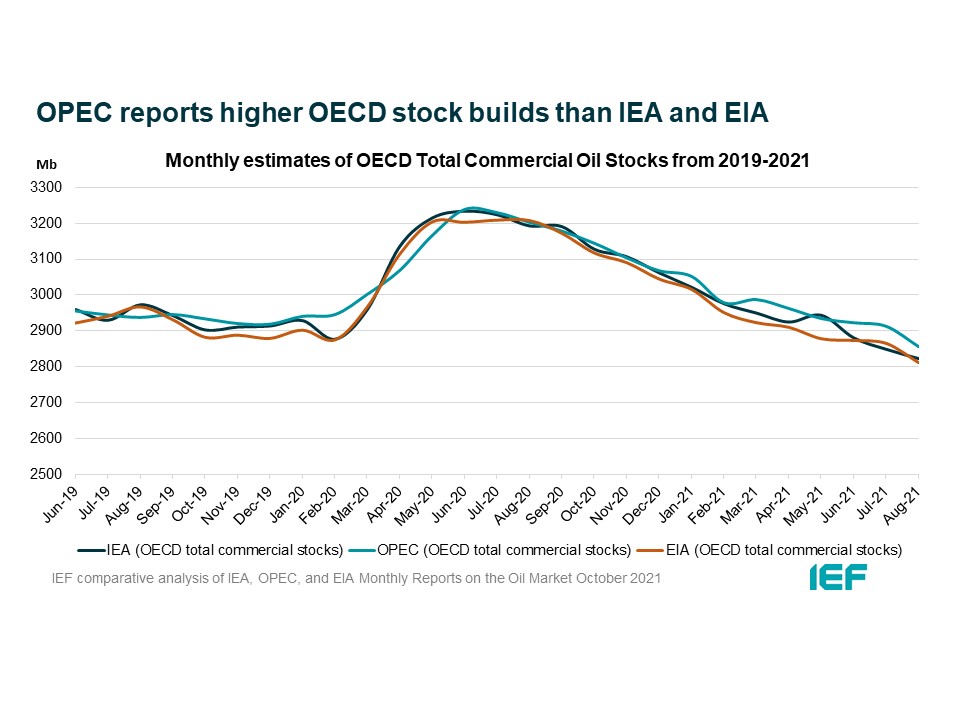
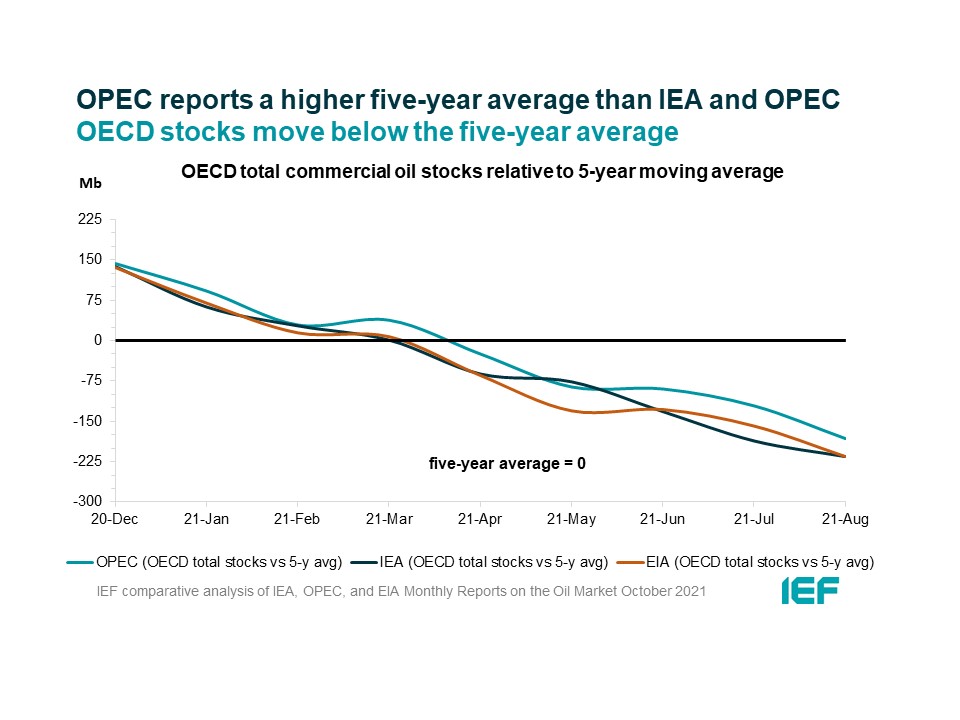
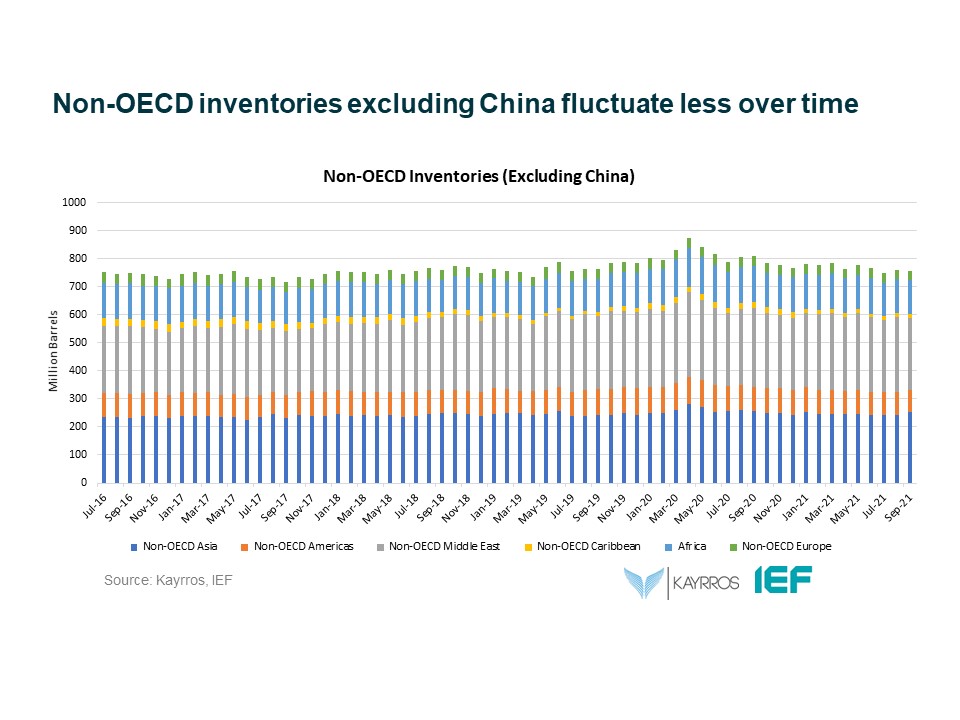
The IEA, OPEC, and EIA continue to display strong alignment on stock figures which are now below the five-year average but still higher than 60 days forward cover.
- The IEA reports OECD stock levels at 2824 mb, which is close to OPEC's assessment of 2855 mb and EIA's assessment of 2811 mb. These are 214.8 mb, 183 mb, and 215.2 mb below the five-year average, respectively.
- According to the IEA, crude oil inventories drew by 29.4 mb while product stocks built by 4.5 mb. Other oils, including NGLs and feedstocks drew by 3.3 mb. According to OPEC, crude oil stocks drew by 22.8 mb while products built by 3.2 mb.
- EIA estimates OECD inventories dropped by 54 mb in August to 2811 mb – 215.2 mb below the five-year average.
- The widest divergence in inventories is between OPEC and the EIA which stands at 44 mb. Total US crude inventories (excluding SPR) amount to about 421 mb, according to the EIA, which is 7 percent below the five-year average for this time of year. OPEC reports US commercial crude oil stocks at about 421 mb and around 35 mb below the five-year average.
2.4 Snapshot (mb/d)
3. Global Analysis
3.1 Demand Data
3.2 Supply Data
3.3 Stock Data
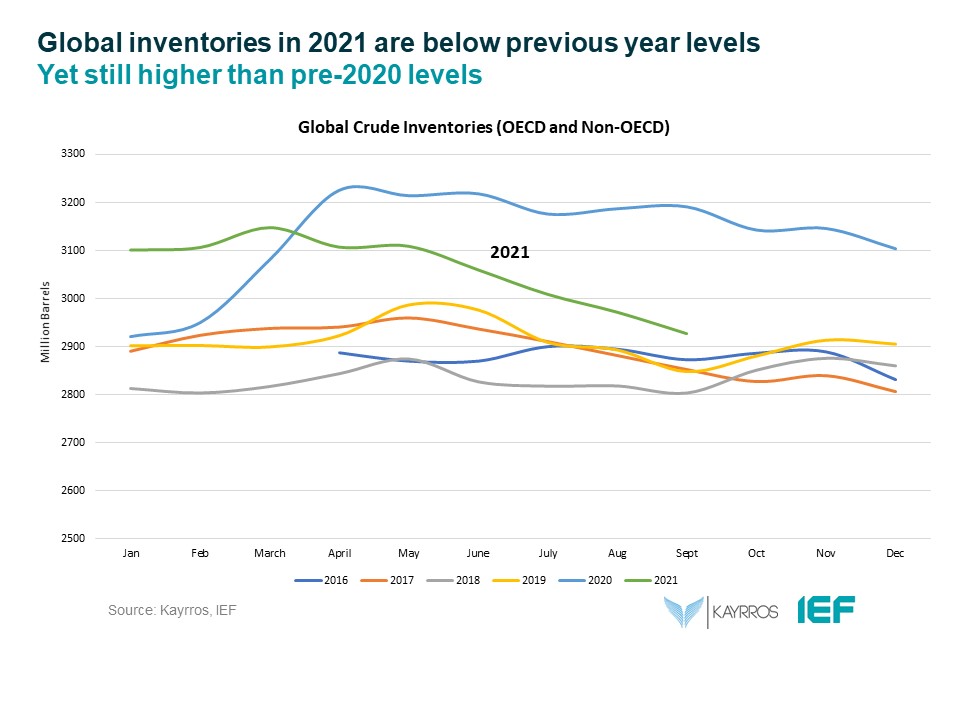
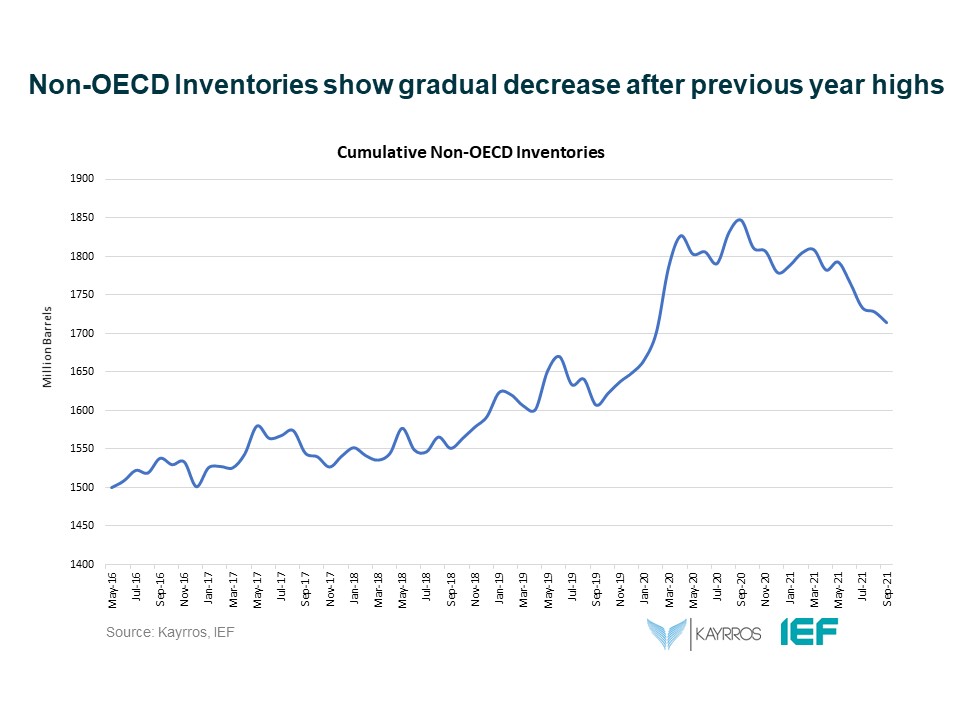
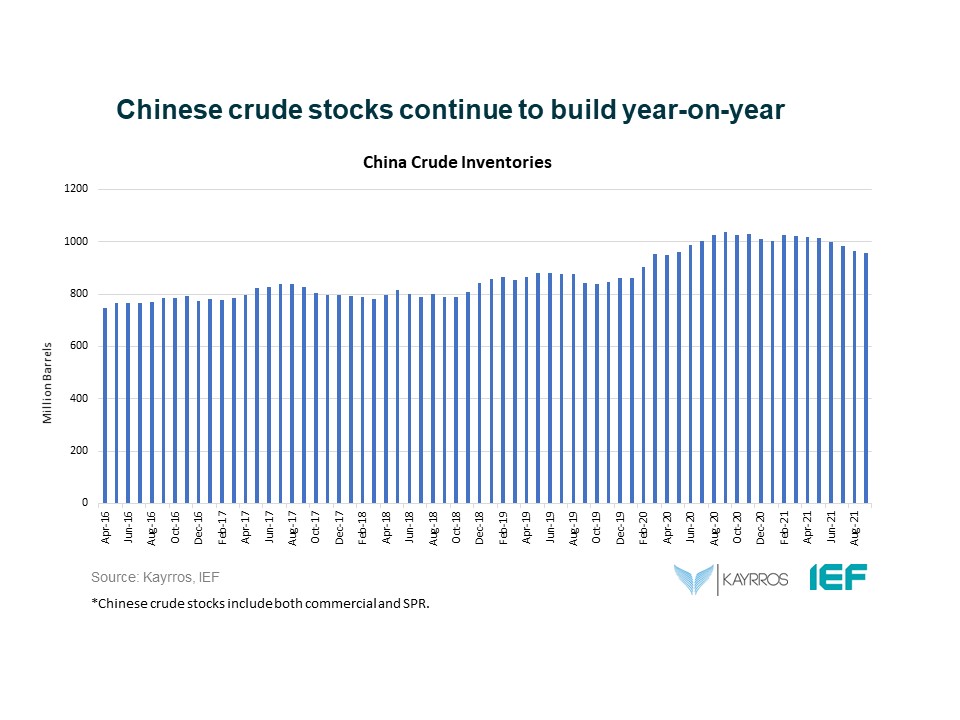
IEF-Kayrros Stock Analysis:
JODI Data:
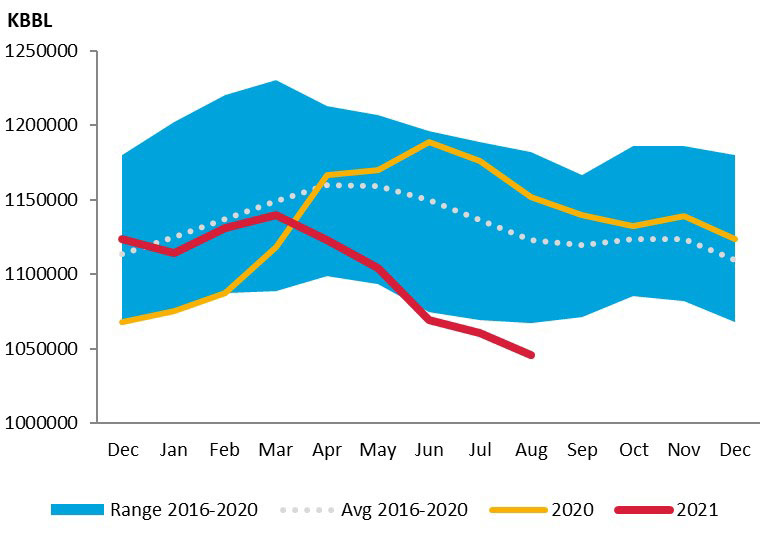
US crude oil closing stock levels in August further fell month-on-month by 14.62 mb to an 83-month-low of 1045.61 mb.
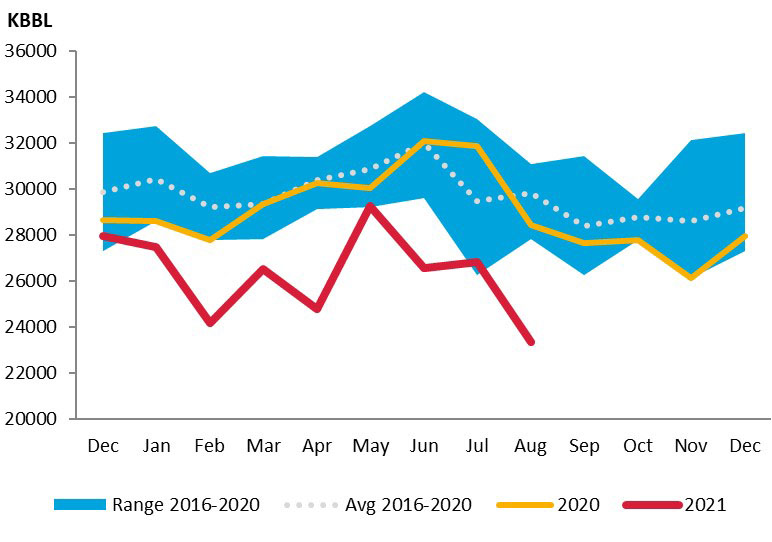
UK crude oil closing stock levels in August fell sharply month-on-month by 3.47 kb to 23.34 mb registering the lowest level since monitoring began in January 2002.
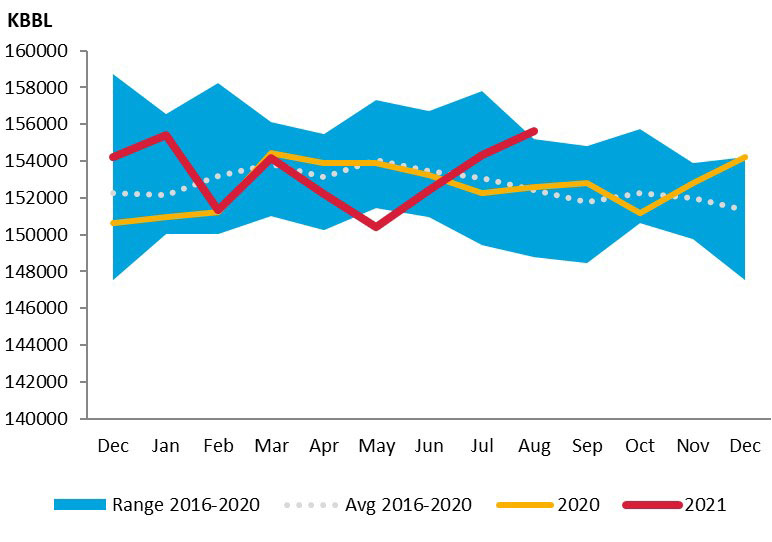
German crude oil closing stock level in August rose again month-on-month by 1.31 MBBL to 155.62 MBBL.
Explanatory Note
The IEF conducts a comprehensive comparative analysis of the short-, medium-, and long-term energy outlooks of the IEA OPEC, and the EIA to inform the IEA-IEF-OPEC Symposium on Energy Outlooks that the IEF hosts in Riyadh as part of the trilateral work programme on a yearly basis.
To inform IEF stakeholders on how perspectives on the oil market of both organisations evolve over time regularly, this monthly summary provides:
- An overview of key events and initiatives in the international policy and market context.
- Key findings and a snapshot overview of data points gained from comparing basic historical data and short-term forecasts of the IEA Oil Market Report, the OPEC Monthly Oil Market Report, and the EIA Short-term Energy Outlook.
- A comparative analysis of oil inventory data reported by the IEA, OPEC, and EIA, and secondary sources in collaboration with Kayrros (added in an updated report on the IEF website).
The International Energy Forum
The International Energy Forum is the leading global facilitator of dialogue between sovereign energy market participants. It incorporates members of International Energy Agency and the Organization of the Petroleum Exporting Countries, and also key players including China, India, Russia and South Africa. The forum's biennial ministerial meetings are the world's largest gathering of energy ministers, where discussions focus on global energy security and the transition towards a sustainable and inclusive energy future. The forum has a permanent secretariat of international staff based in the Diplomatic Quarter of Riyadh, Saudi Arabia. For more information visit www.ief.org.