")

Comparative Analysis of Monthly Reports on the Oil Market
1. International Policy and Market Context
Russia Invades Ukraine
- Initial energy market data shows that both non-energy and energy sanctions severely reduced and dislocated Russian oil supplies leading to extreme volatility as markets sought realignment in a new and highly uncertain risk environment.
- As security concerns fray producer consumer relations and reshape energy market policy priorities, sustained price volatility will fan inflation and potentially interrupt the post pandemic recovery.
- Data from the Joint Organizations Data Initiative (JODI) shows that in addition to sanctions on already tight supply/demand balances, markets remain vulnerable to low inventories and spare capacity.
- Western disengagement from Russia will slow global economic growth and limit prospects for just and orderly transitions to achieve shared UN goals.
Extreme energy price volatility prompts government measures
- Brent oil crude prices spiked to their highest level since 2008 breaking $130 after the US and UK confirmed a ban on Russian imports but have since returned to the $100 mark. Concerns about natural gas shortages in Europe drove futures for gas in the northwest European market to a record-high of 345 euros on 7 March – equivalent to oil at $600 per barrel. The price has since dropped to just over 100 euros. Short-term government measures to shield consumers include tax relief, subsidies, and stimulating domestic oil and gas production.
COVID risks remain as headwinds to energy demand rise
- Reinstated lockdowns in major energy demand centers in China reduce non-OECD energy demand. Energy consumption is exposed to rising uncertainties stemming from the impact of surging commodity prices and US monetary tightening. The uncertain tail end of the pandemic and impact of sanctions on Russia and other producers constrains investment and trade and fragments still brittle supply chains.
26th "OPEC Plus" meeting stays the course on production
- On 2 March, OPEC and non-OPEC countries reconfirmed the production adjustment plan and the monthly production adjustment mechanism approved at the 19th OPEC and non-OPEC Ministerial Meeting on 18 July. OPEC plus decided to increase the monthly overall production by 0.4 mb/d for the month of April 2022 accordingly. The 27th OPEC and non-OPEC Ministerial Meeting is scheduled for 31 March 2022.
The IEA and EU announce plans to reduce dependence on hydrocarbons
- On 3 March, The IEA provided a 10-point plan to the EU for reducing reliance on Russian oil, gas, and coal supplies by over a third. On 8 March, the European Commission proposed to make Europe independent from Russian fossil fuels well before 2030, first by reducing gas imports from Russia by two-thirds over the short-term.
- Europe has refrained from sanctioning Russian energy supplies. Pre-pandemic it relied on Russian oil, gas, and coal for 27, 41 and 47 percent of its imports, according to Eurostat Data.
2. Key Points
2.1 Demand
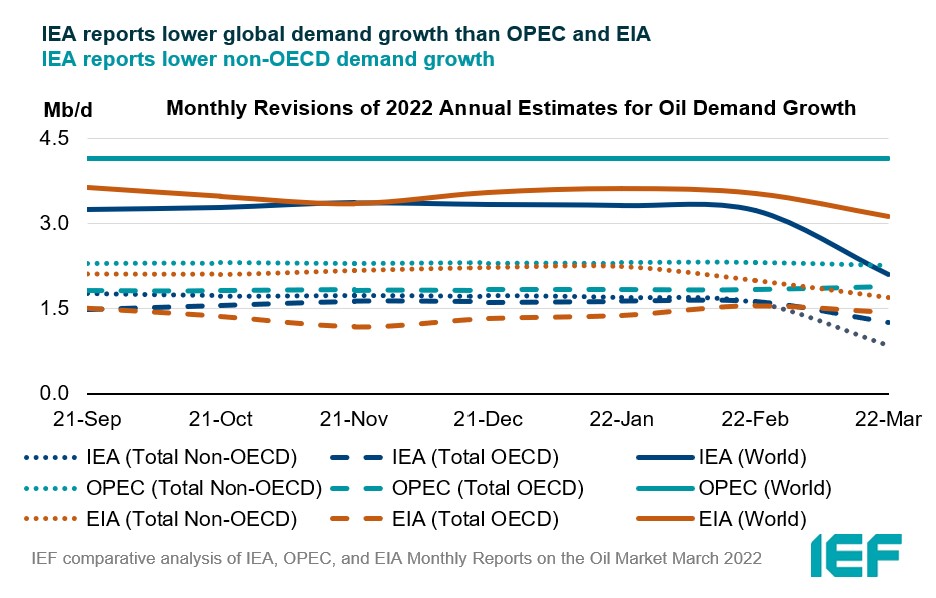
IEA expects substantially lower demand growth than OPEC and EIA in 2022.
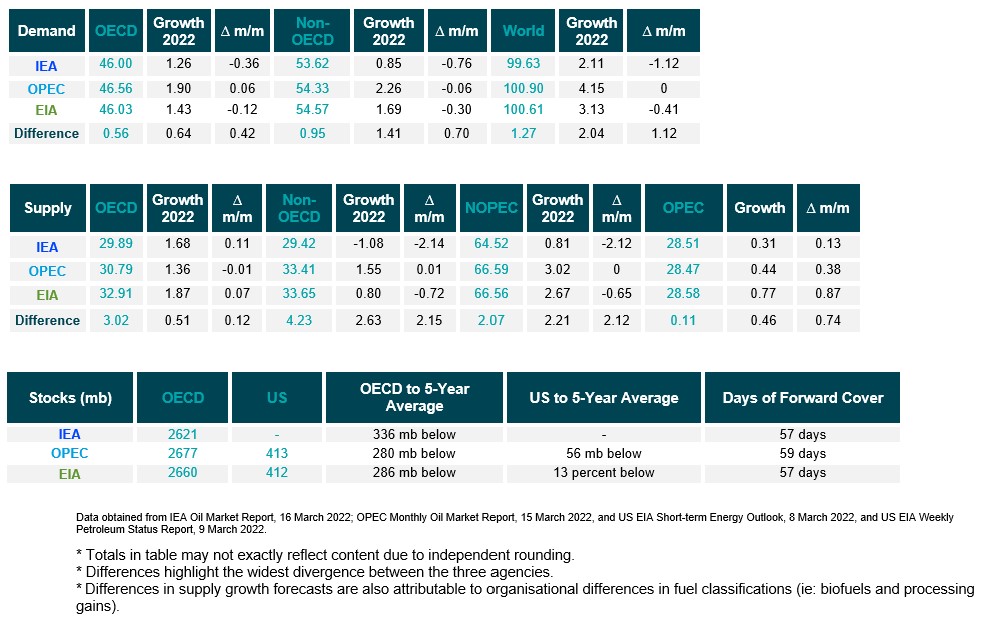
- IEA's demand growth assessment falls by 1.12 mb/d to 2.11 mb/d for 2022 due to economic uncertainties caused by the Ukraine crisis.
- OPEC's y-o-y forecast remains the same at 4.15 mb/d.
- EIA's assessment falls by 410 kb/d for a growth of 3.13 mb/d this year. The IEA, OPEC, and EIA estimates for absolute world demand are now 99.63 mb/d, 100.90 mb/d, and 100.61 mb/d for 2022, respectively.
The IEA, OPEC, and EIA drastically differ on non-OECD demand growth in 2022.
- The IEA's assessment of y-o-y non-OECD demand growth falls by 760 kb/d to 0.85 mb/d, while OPEC's estimate falls by 60 kb/d for a growth of 2.26 mb/d. EIA non-OECD demand growth falls by 300 kb/d for a growth of 1.69 mb/d.
- The IEA's estimate for OECD demand growth falls by 360 kb/d to 1.26 mb/d for 2022 while OPEC's projection rises by 60 kb/d for a growth of 1.90 mb/d. EIA sees OECD growth falling by 120 kb/d reaching 1.43 mb/d this year.
- The biggest difference in OECD and non-OECD demand growth estimates is between IEA and OPEC which differ by 640 kb/d and 1.41 mb/d, respectively.
2.2 Supply
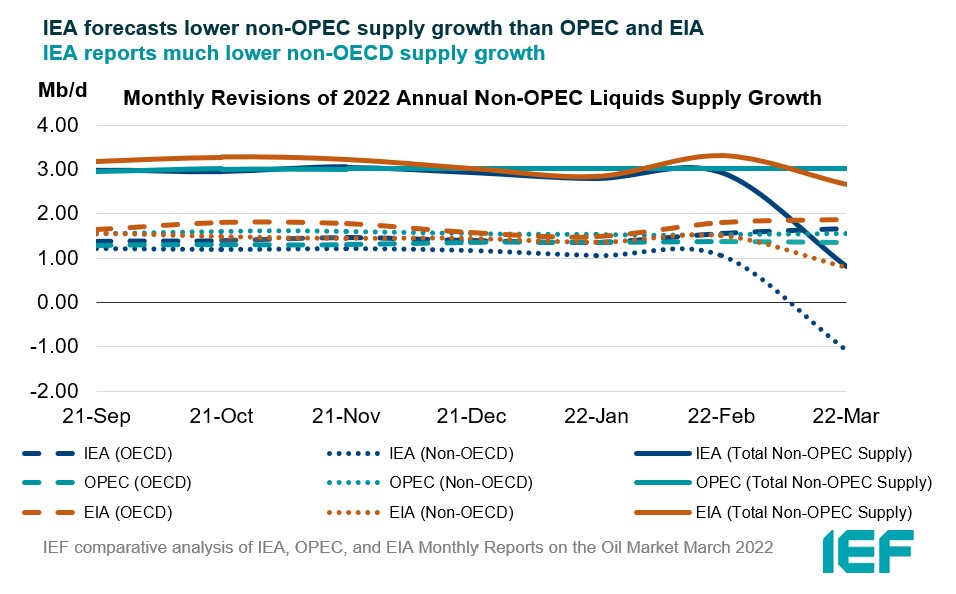
IEA non-OPEC supply growth falls sharply in 2022 compared to OPEC and EIA.
- The IEA's March assessment for non-OPEC supply falls by 2.12 mb/d to reach a growth of 0.81 mb/d while OPEC's estimate remains the same at 3.02 mb/d. The EIA's assessment falls by 650 kb/d for an overall growth of 2.67 mb/d. In absolute values, the IEA, OPEC, and EIA estimate non-OPEC supply at 64.52 mb/d, 66.59 mb/d, and 66.56 mb/d, respectively for 2022.
- The IEA estimates OECD oil supply growth this year at 1.68 mb/d, OPEC pegs it at 1.36 mb/d, and EIA reports growth at 1.87 mb/d, an increase of 110 kb/d, a decrease of 10 kb/d, and an increase of 70 kb/d, respectively. In absolute terms, the IEA, OPEC, and EIA estimate OECD oil supply at 29.89 mb/d, 30.79 mb/d, and 32.91 mb/d, respectively for 2022. The difference between OPEC and EIA on OECD supply growth is 510 kb/d.
IEA forecasts a decline for non-OECD supply in 2022 while OPEC and EIA continue to see growth.
- The IEA made a drastic downwards revision in its estimate of non-OECD supply for 2022 from a growth of 1.06 in February to a decline of 1.08 mb/d – a change of 2.14 mb/d.
- The EIA also revised its forecast down by 720 kb/d for a growth of 0.80 while OPEC marginally raised its supply forecasts by 10 kb/d to 1.55 mb/d.
- In absolute values, the IEA, OPEC, and EIA non-OECD supply estimates are 29.42 mb/d, 33.41 mb/d, and 33.65 mb/d, respectively for 2022 with the highest divergence in growth between IEA and OPEC at 2.63 mb/d.
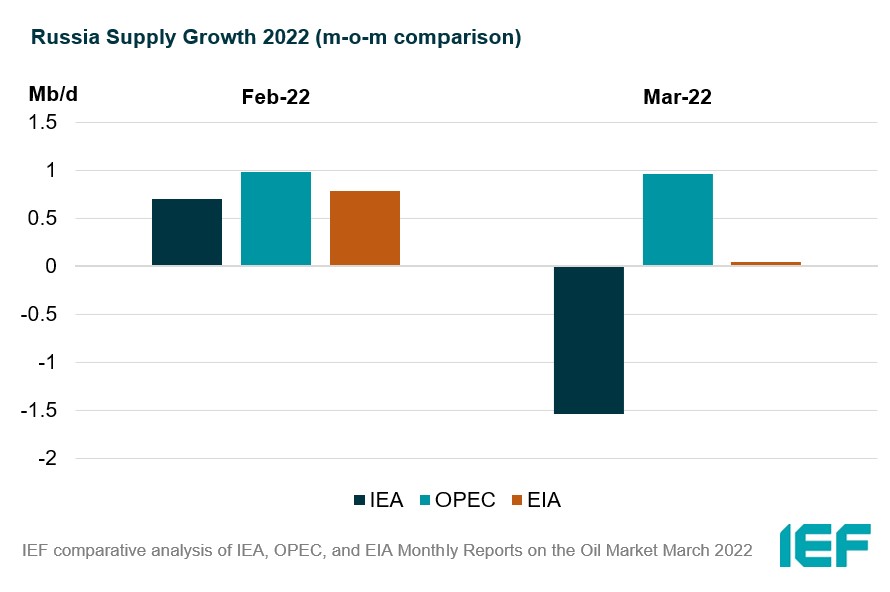
The IEA and OPEC revise OPEC production estimates upwards while EIA revises this downwards for January.
- The IEA revised its OPEC production estimate for January upward by 310 kb/d month-on-month (m-o-m) to reach total production of 28.51 mb/d. OPEC's assessment of its own production was revised upwards by 440 kb/d to 28.47 mb/d. The EIA also increased its assessment by 770 kb/d for total OPEC crude production of 28.58 mb/d.
2.3 Stocks
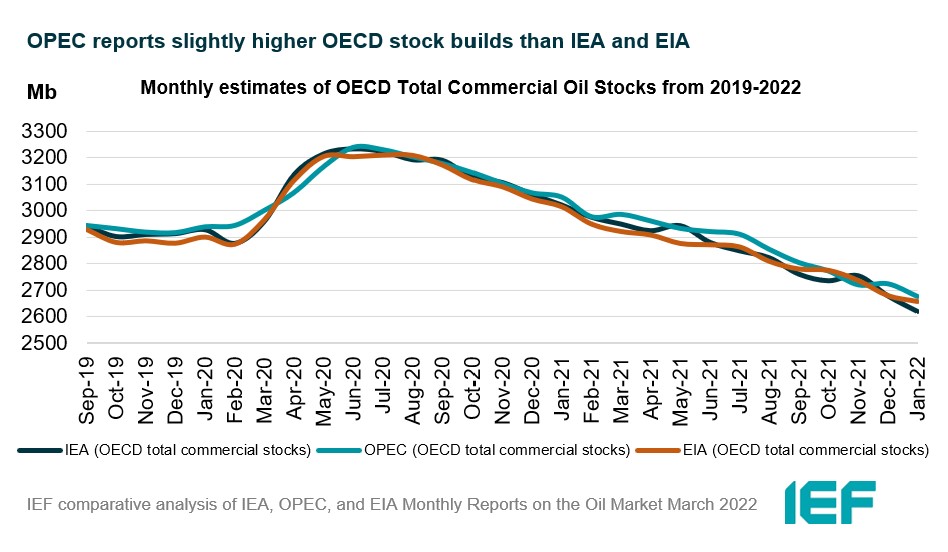
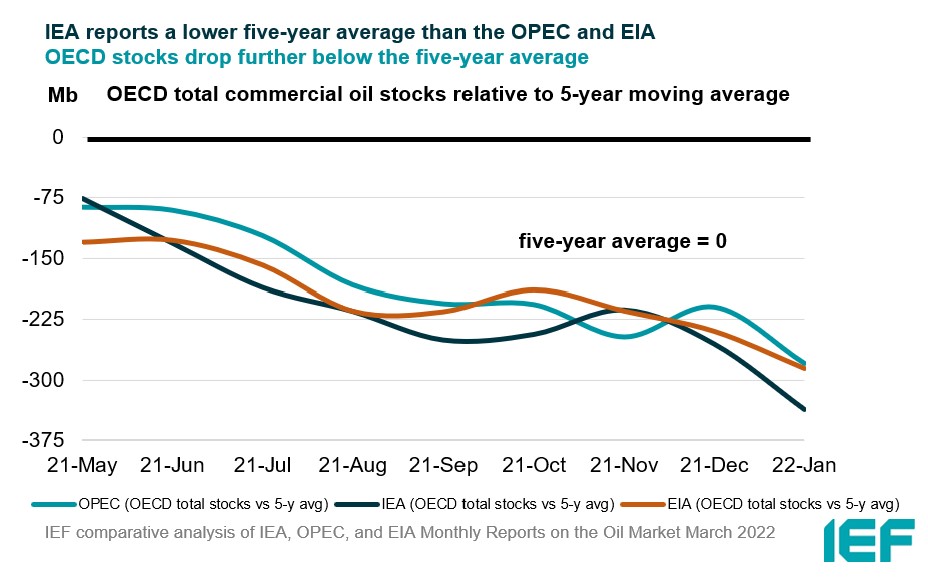
The IEA, OPEC, and EIA continue to display strong alignment on stock figures which are below the five-year average and now below 60 days forward cover.
- The IEA reports OECD stock levels at 2621 mb, which is close to OPEC's assessment of 2677 mb and EIA's assessment of 2660 mb. These are around 336 mb, 280 mb, and 286 mb below the five-year average, respectively.
- According to the IEA, crude oil inventories drew by 18.7 mb while product stocks drew by 4.9 mb. Other oils, including NGLs and feedstocks built by 1.7 mb. According to OPEC, crude oil stocks drew by 8.7 mb while products built by 5.5 mb.
- EIA estimates OECD inventories dropped by 22 mb in December to 2660 mb – 286 mb below the five-year average.
- The widest divergence in inventories is between the IEA and OPEC which stands at 56 mb. Total US crude inventories (excluding SPR) amount to about 412 mb, according to the EIA, which is 13 percent below the five-year average for this time of year. OPEC reports US commercial crude oil stocks at about 413 mb and around 56 mb below the five-year average.
2.4 Snapshot (mb/d)
3. Global Analysis
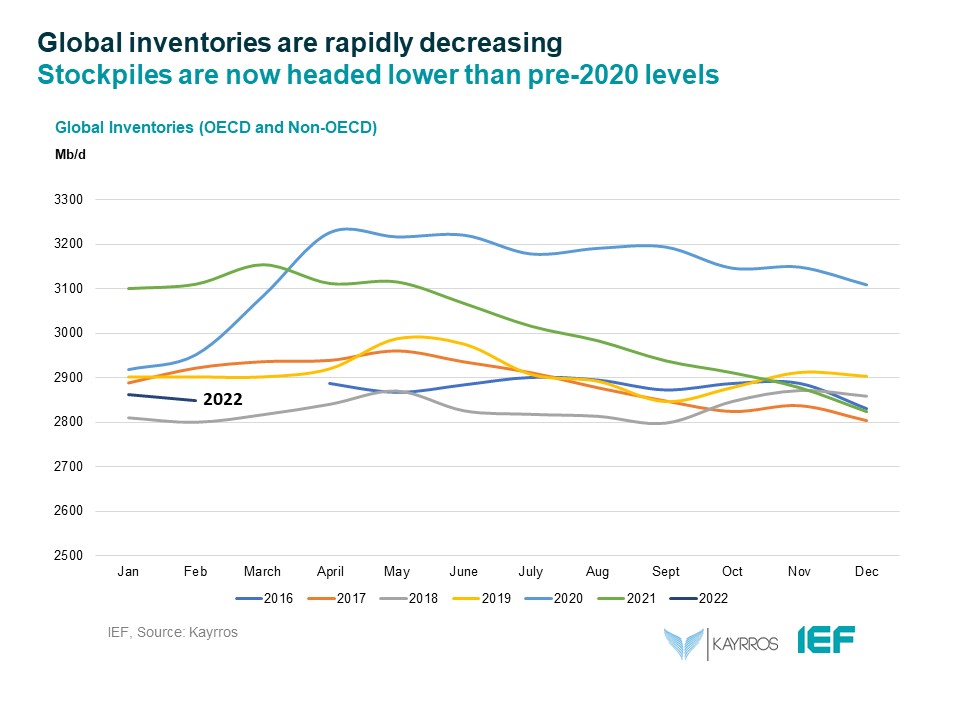
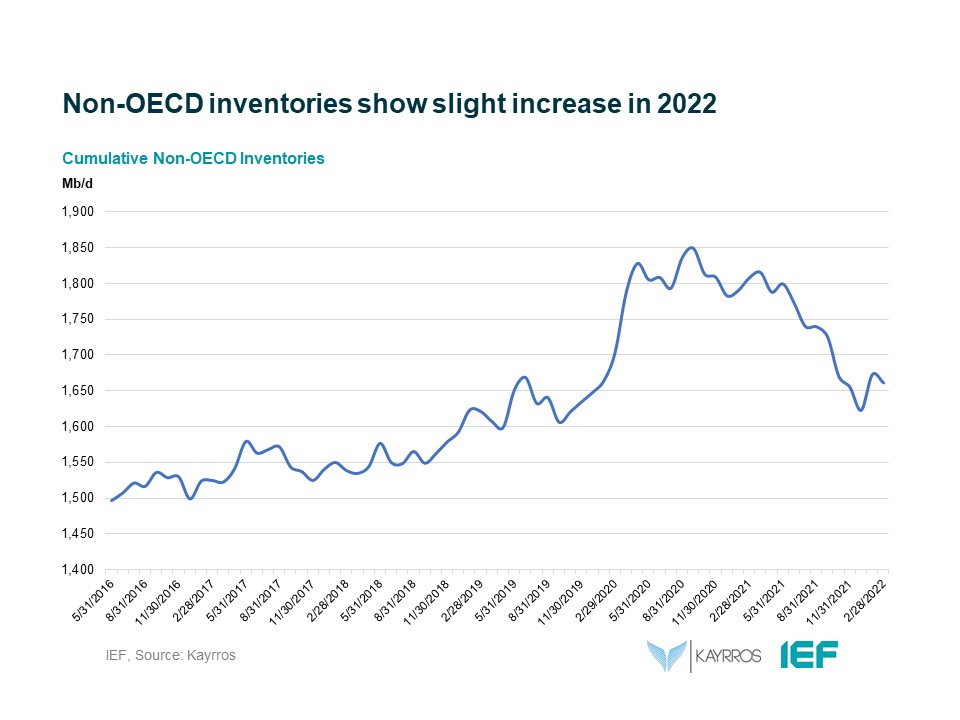
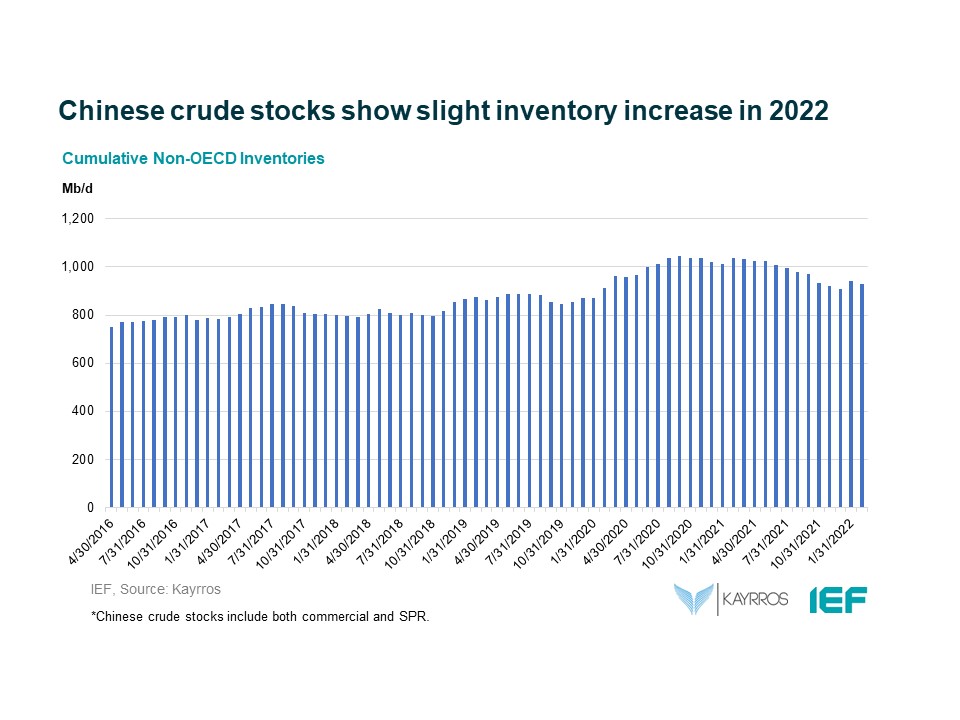
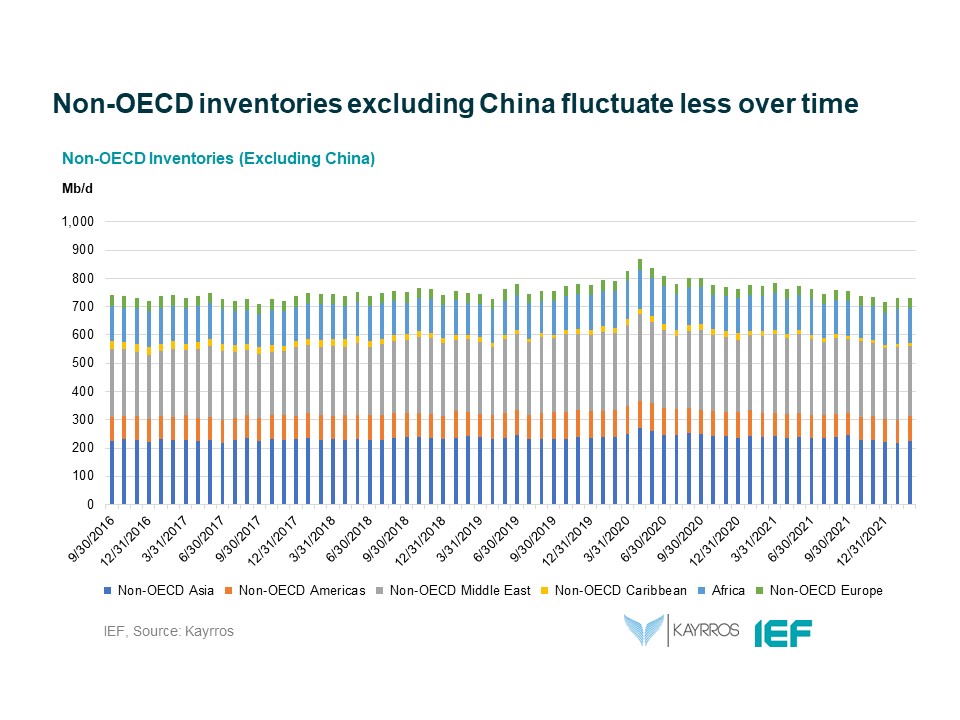
IEF-Kayrros Stock Analysis:
Explanatory Note
The IEF conducts a comprehensive comparative analysis of the short-, medium-, and long-term energy outlooks of the IEA, OPEC, and the EIA to inform the IEA-IEF-OPEC Symposium on Energy Outlooks that the IEF hosts in Riyadh as part of the trilateral work programme on a yearly basis.
To inform IEF stakeholders on how perspectives on the oil market of both organisations evolve over time regularly, this monthly summary provides:
- An overview of key events and initiatives in the international policy and market context.
- Key findings and a snapshot overview of data points gained from comparing basic historical data and short-term forecasts of the IEA Oil Market Report, the OPEC Monthly Oil Market Report, and the EIA Short-term Energy Outlook.
- A comparative analysis of oil inventory data reported by the IEA, OPEC, and EIA, and secondary sources in collaboration with Kayrros (added in an updated report on the IEF website).
The International Energy Forum
The International Energy Forum is the leading global facilitator of dialogue between sovereign energy market participants. It incorporates members of International Energy Agency and the Organization of the Petroleum Exporting Countries, and also key players including China, India, Russia and South Africa. The forum's biennial ministerial meetings are the world's largest gathering of energy ministers, where discussions focus on global energy security and the transition towards a sustainable and inclusive energy future. The forum has a permanent secretariat of international staff based in the Diplomatic Quarter of Riyadh, Saudi Arabia. For more information visit www.ief.org.