")

Comparative Analysis of Monthly Reports on the Oil Market
1. International Policy and Market Context
Wildfires in Canada shut in production
- On 6 May, the province of Alberta declared a state of emergency as more than 100 active fires burned across the energy-rich province. Some oil and gas producers in the province of Alberta temporarily stopped production shuttering almost 4 percent of national energy production. Companies have since restarted production but remain on high alert. Canada is the world's fourth-largest crude producer and about 80 percent of its oil comes from Alberta. The fires primarily affected light oil and natural gas producers.
Indian power demand surges to record high
- Soaring temperatures across India coupled with higher manufacturing capacity utilization pushed the country's electricity demand to a record high in late April – 2 percent higher than last summer's maximum. The government is meeting increased demand for power including ensuring availability of generation capacity, by increasing production and imports of coal, and greater procurement of LNG from abroad.
Oil and natural gas prices fall but uncertainties and risks remain
- Lower power demand amid mild spring weather in most of Europe and high inventories due to record LNG imports over the last year has lowered global gas prices. Spot LNG prices for delivery to North Asia in June have plunged in recent weeks and were down for a third consecutive week amid weak demand and high inventories in Asia. Despite the relative calm on energy markets, uncertainties around economic recovery and weather patterns, and risks of more supply disruptions are likely to impact energy markets.
Global refining capacity forecast to see largest increase in 45 years
- Global refining capacity will increase by 1.5 mb/d in 2023 and by another 2.4 mb/d in 2024 which is the largest two-year increase in almost half a century according to RBC Capital Markets. Previously delayed projects during the pandemic are now moving ahead and new projects seek to accommodate growing demand for fuels and petrochemicals primarily in non-OECD markets. While new refining capacity will bring down margins in the medium-term, it may provide greater supply security and ease inflationary pressures during a time of crisis.
Major Economies Forum announces Carbon Management Challenge
- On 20 April, Australia, Canada, Egypt, the European Union, Japan, the Kingdom of Saudi Arabia, the United Arab Emirates, and the United States, as well as Norway and Denmark, launched the Carbon Management Challenge. Further announcements to accelerate the development and deployment of carbon capture, utilization, and storage (CCUS) and carbon dioxide removal (CDR) technologies will be announced at COP28.
G7 agree to the phase-out of unabated fossil fuels by 2050
- On 16 April, G7 countries' climate ministers agreed to speed up the phaseout of unabated fossil fuels. In a joint statement at their meeting in Sapporo, Japan, the ministers agreed "to accelerate the phase-out of unabated fossil fuels so as to achieve net zero in energy systems by 2050 at the latest". The ministers stopped short of endorsing a 2030 deadline for phasing out coal and left the door open for continued investment in natural gas.
2. KEY POINTS
2.1 DEMAND
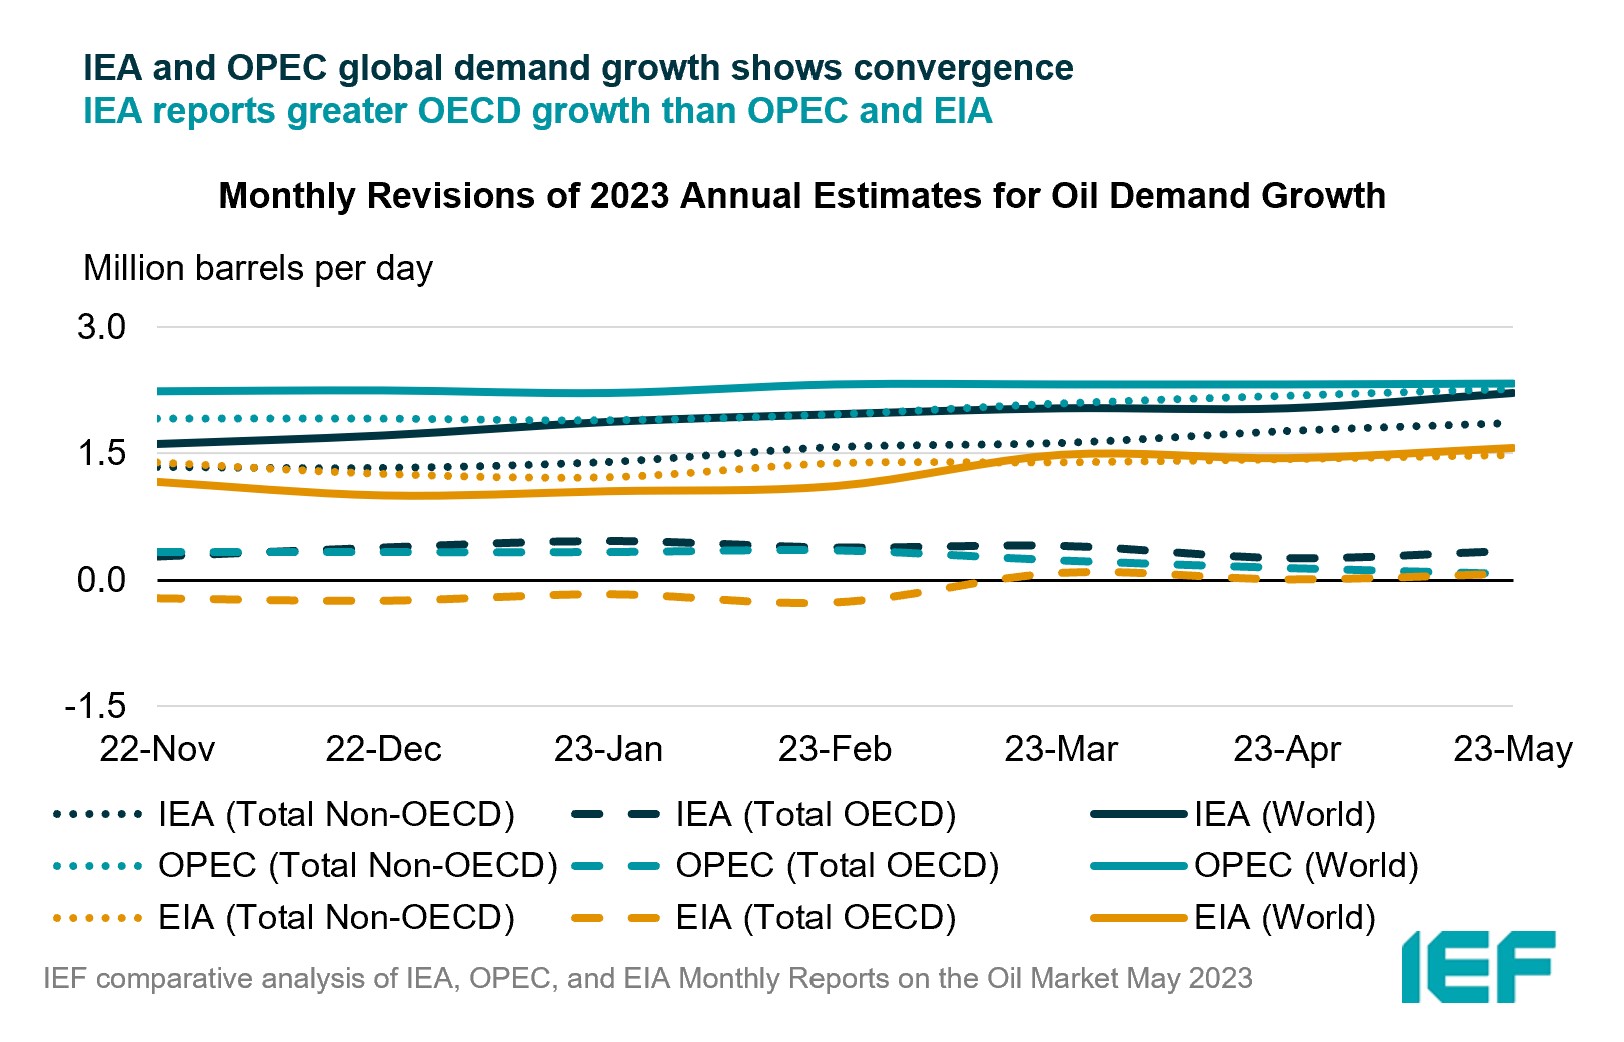
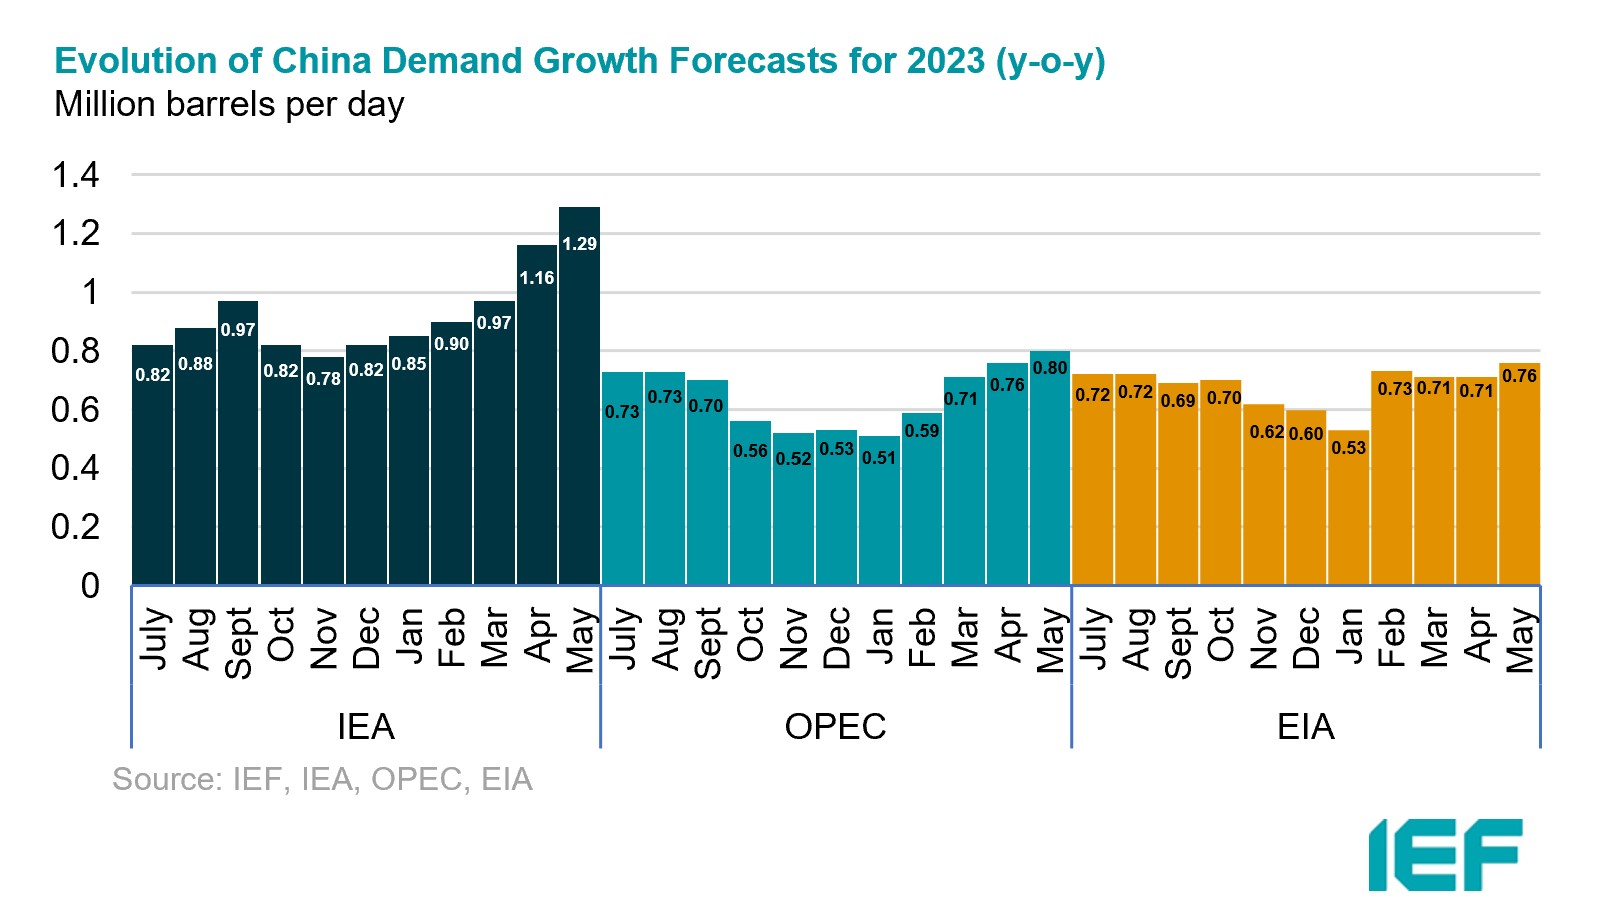
IEA, OPEC, and EIA global demand growth assessments rise.
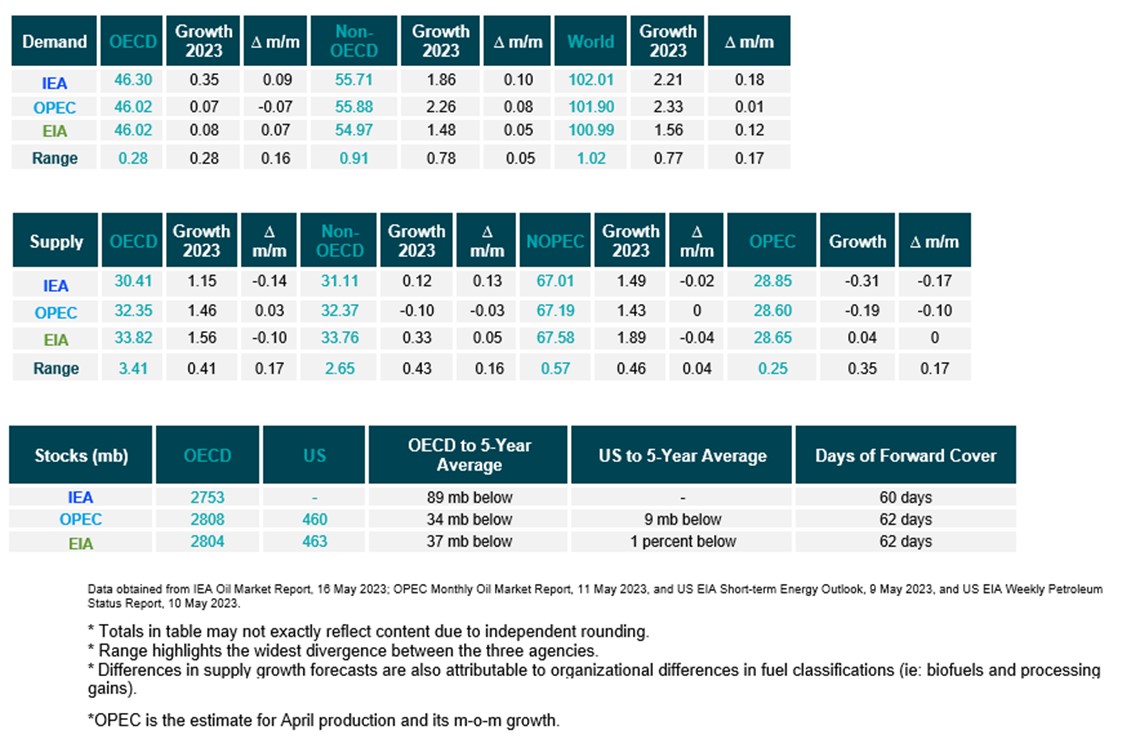
- The IEA and OPEC year-on-year (y-o-y) demand growth assessments for 2023 rise to 2.21 mb/d and 2.33 mb/d, a growth of 180 kb/d and 10 kb/d, respectively.
- The EIA's growth forecast also rises by 120 kb/d for a growth of 1.56 mb/d in 2023.
- The IEA, OPEC, and EIA estimates for absolute world demand are now 102.01 mb/d, 101.90 mb/d, and 100.99 mb/d for 2023, respectively.
IEA and EIA OECD demand growth assessments rise while OPEC falls slightly.
- The IEA's assessment of y-o-y OECD demand growth rises by 90 kb/d to 0.35 mb/d, while EIA's estimate rises by 70 kb/d to 0.08 mb/d. OPEC's OECD demand growth falls by 70 kb/d to 0.07 mb/d.
- The IEA, OPEC and the EIA non-OECD demand growth assessments rise by 100 kb/d, 80 kb/d mb/d, and 50 kb/d for a growth of 1.86 mb/d, 2.26 mb/d, and 1.48 mb/d, respectively.
- The largest divergence in OECD and non-OECD demand growth estimates are between the IEA and the OPEC and EIA and OPEC at 0.28 and 0.78, respectively.
2.2 SUPPLY
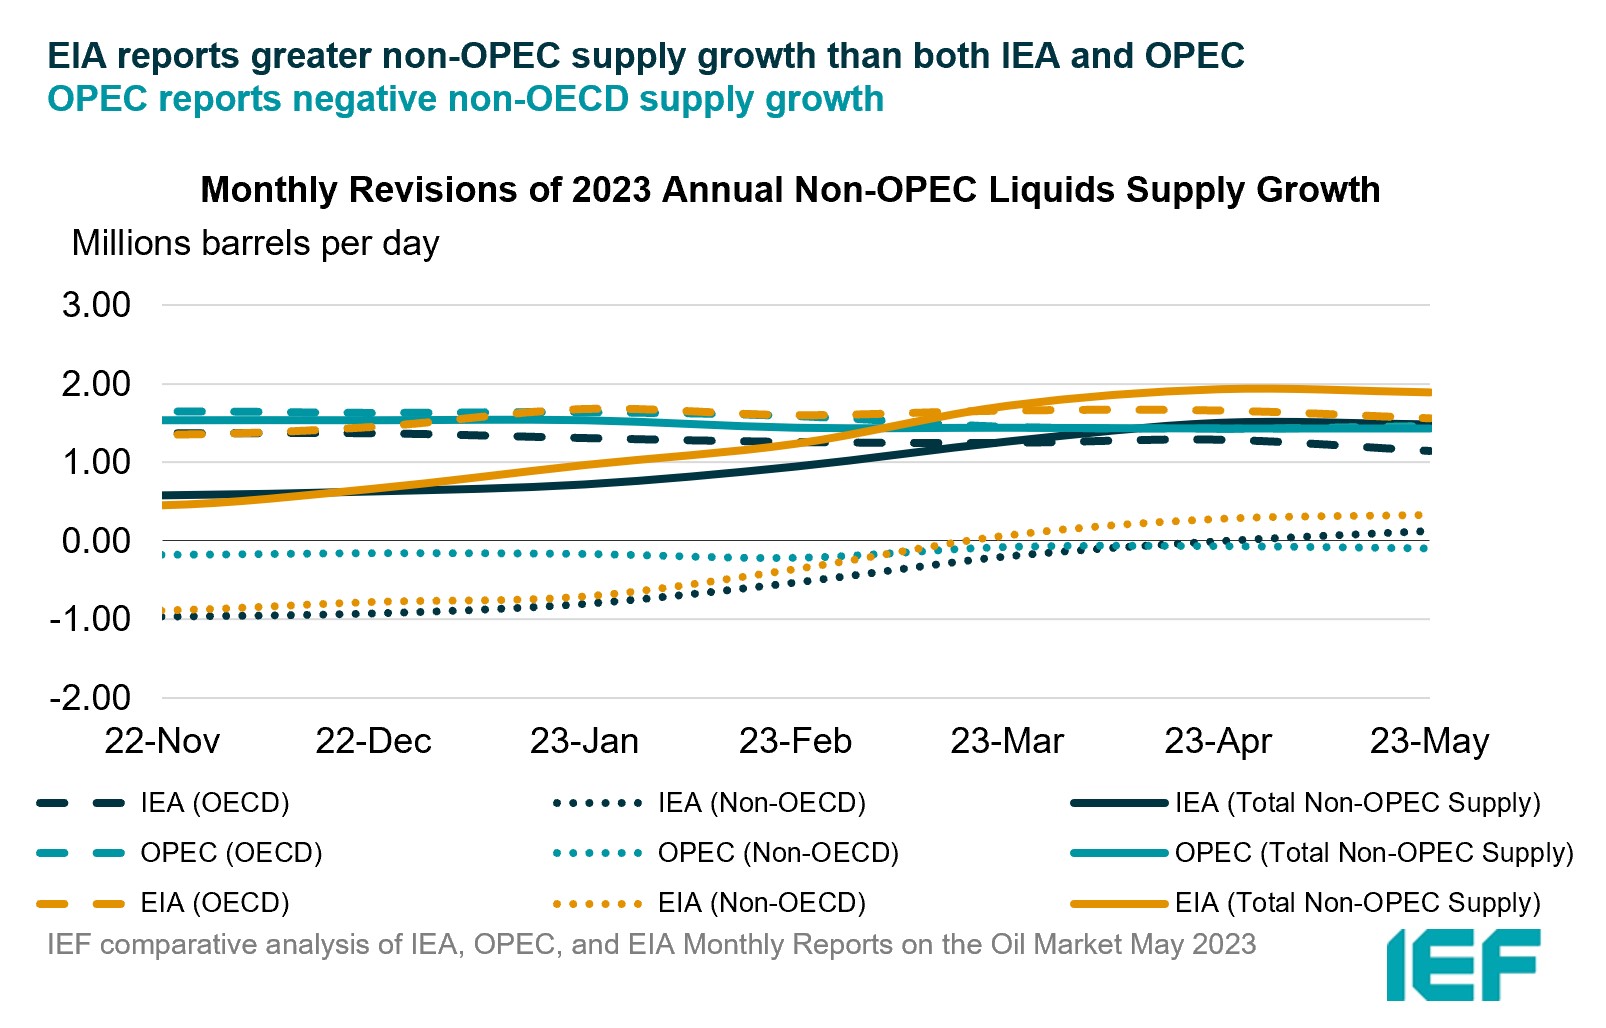
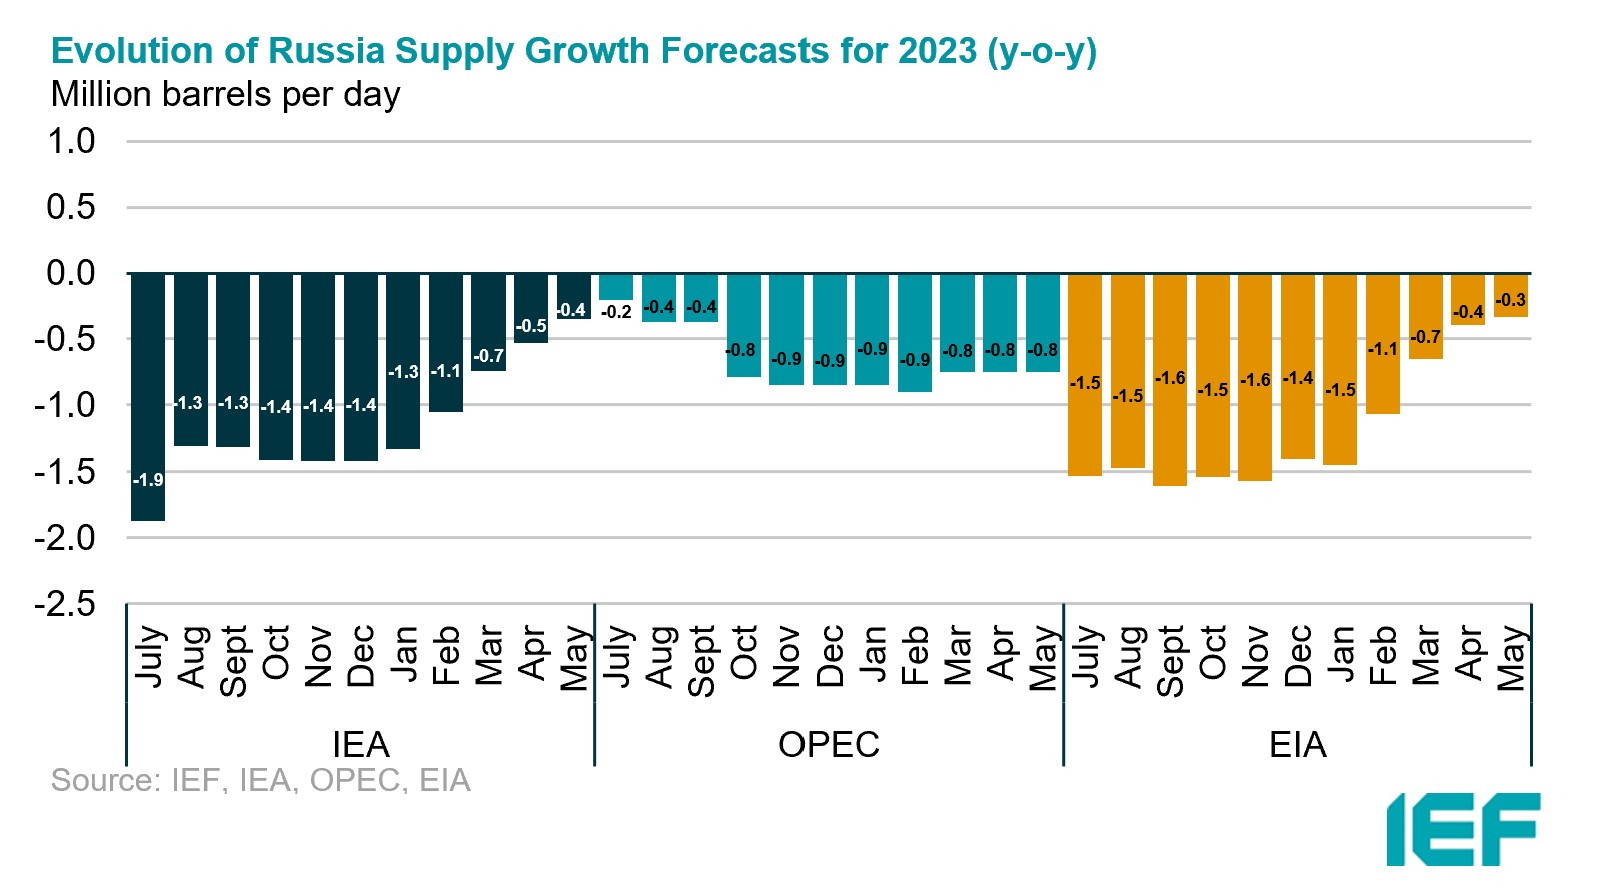
IEA and EIA non-OPEC supply growth assessments fall slightly while OPEC remains steady.
- The IEA's May 2023 assessment for non-OPEC supply falls by 20 kb/d to reach a growth of 1.49 mb/d while OPEC's estimate remains the same at 1.43 mb/d. The EIA's assessment also falls by 40 kb/d for an overall growth of 1.89 mb/d. In absolute values, the IEA, OPEC, and the EIA estimate non-OPEC supply at 67.01 mb/d, 67.19 mb/d, and 67.58 mb/d, respectively for 2023.
- The IEA estimates OECD oil supply growth this year at 1.15 mb/d, OPEC pegs it at 1.46 mb/d, and the EIA reports growth at 1.56 mb/d, a decrease of 140 kb/d for the IEA, a decrease of 100 kb/d for EIA, and a rise of 30 kb/d for OPEC. In absolute terms, the IEA, OPEC, and the EIA estimate OECD oil supply at 30.41 mb/d, 32.35 mb/d, and 33.82 mb/d, respectively for 2023. The largest divergence of OECD supply growth estimates is between the EIA and the IEA at 410 kb/d.
IEA and EIA report rises in non-OECD supply while OPEC falls slightly.
- The IEA's assessment for non-OECD supply rises by 130 kb/d to 0.12 mb/d.
- OPEC's non-OECD growth falls slightly by 30 kb/d for a decline of 0.10 mb/d while the EIA revised its non-OECD growth forecast up by 50 kb/d for a growth of 0.33 mb/d.
- In absolute values, the IEA, OPEC, and the EIA non-OECD supply estimates are 31.11 mb/d, 32.37 mb/d, and 33.76 mb/d, respectively for 2023 with the largest divergence in growth estimates between OPEC and EIA at 430 kb/d.
IEA and OPEC report decreases in OPEC production, while EIA reports an increased output in April.
- The IEA reported OPEC production fell by 310 kb/d to 28.85 mb/d.
- OPEC showed OPEC production fell month-on-month by 190 kb/d to 28.60 mb/d.
- The EIA assessed OPEC production at 28.65 mb/d, up 40 kb/d month-on-month.
2.3 STOCKS
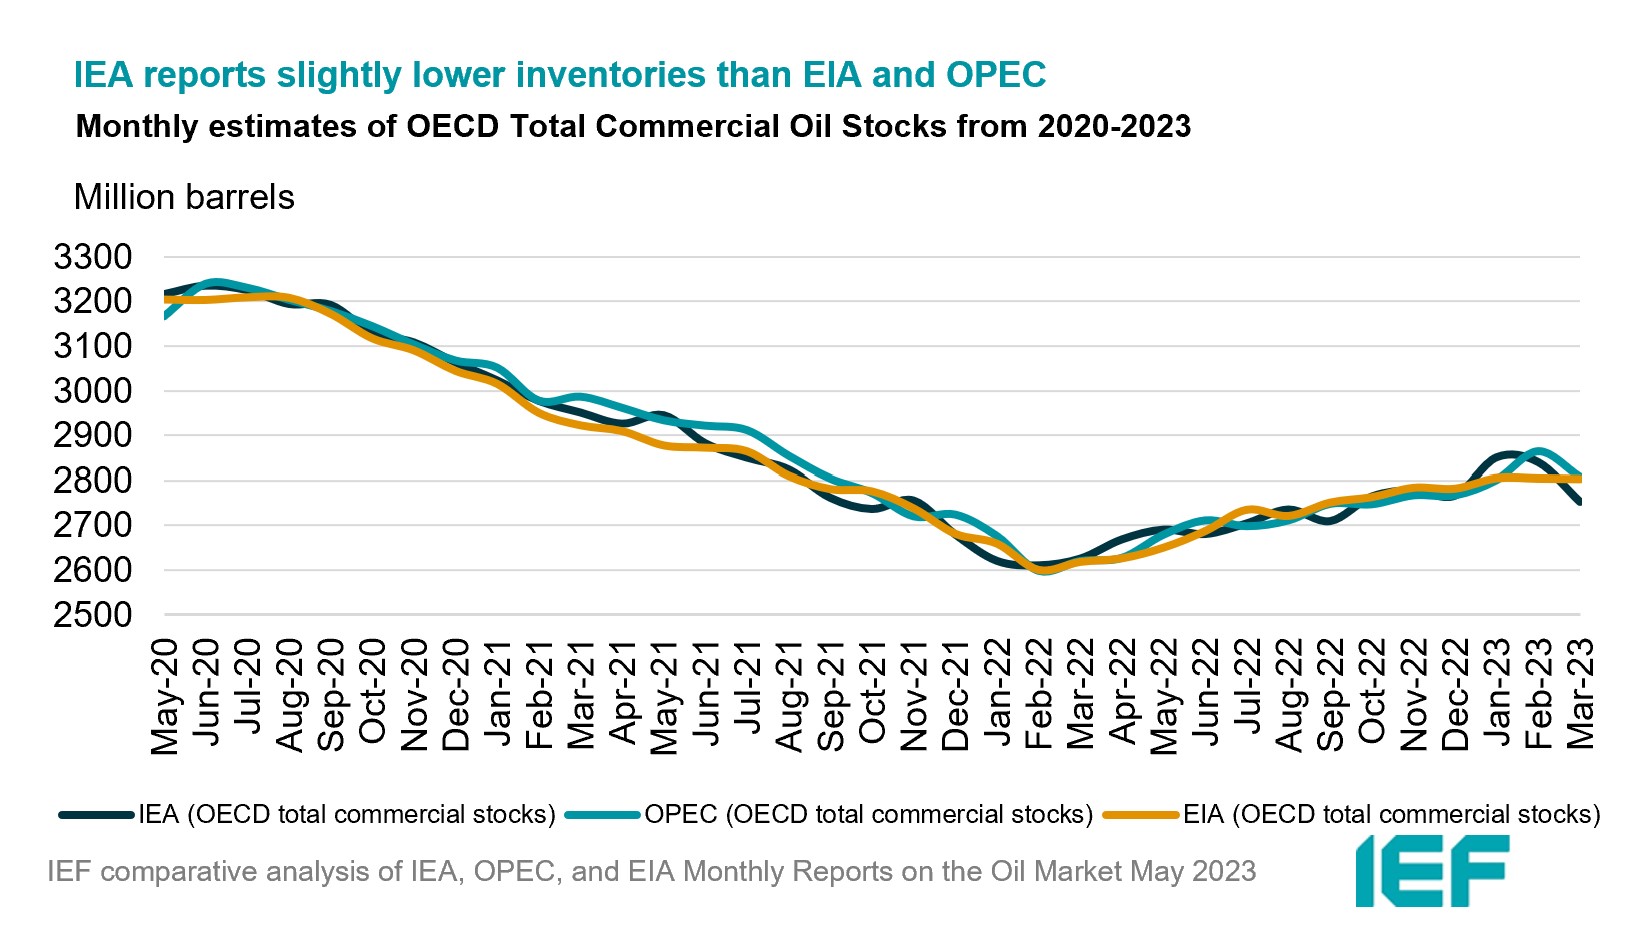
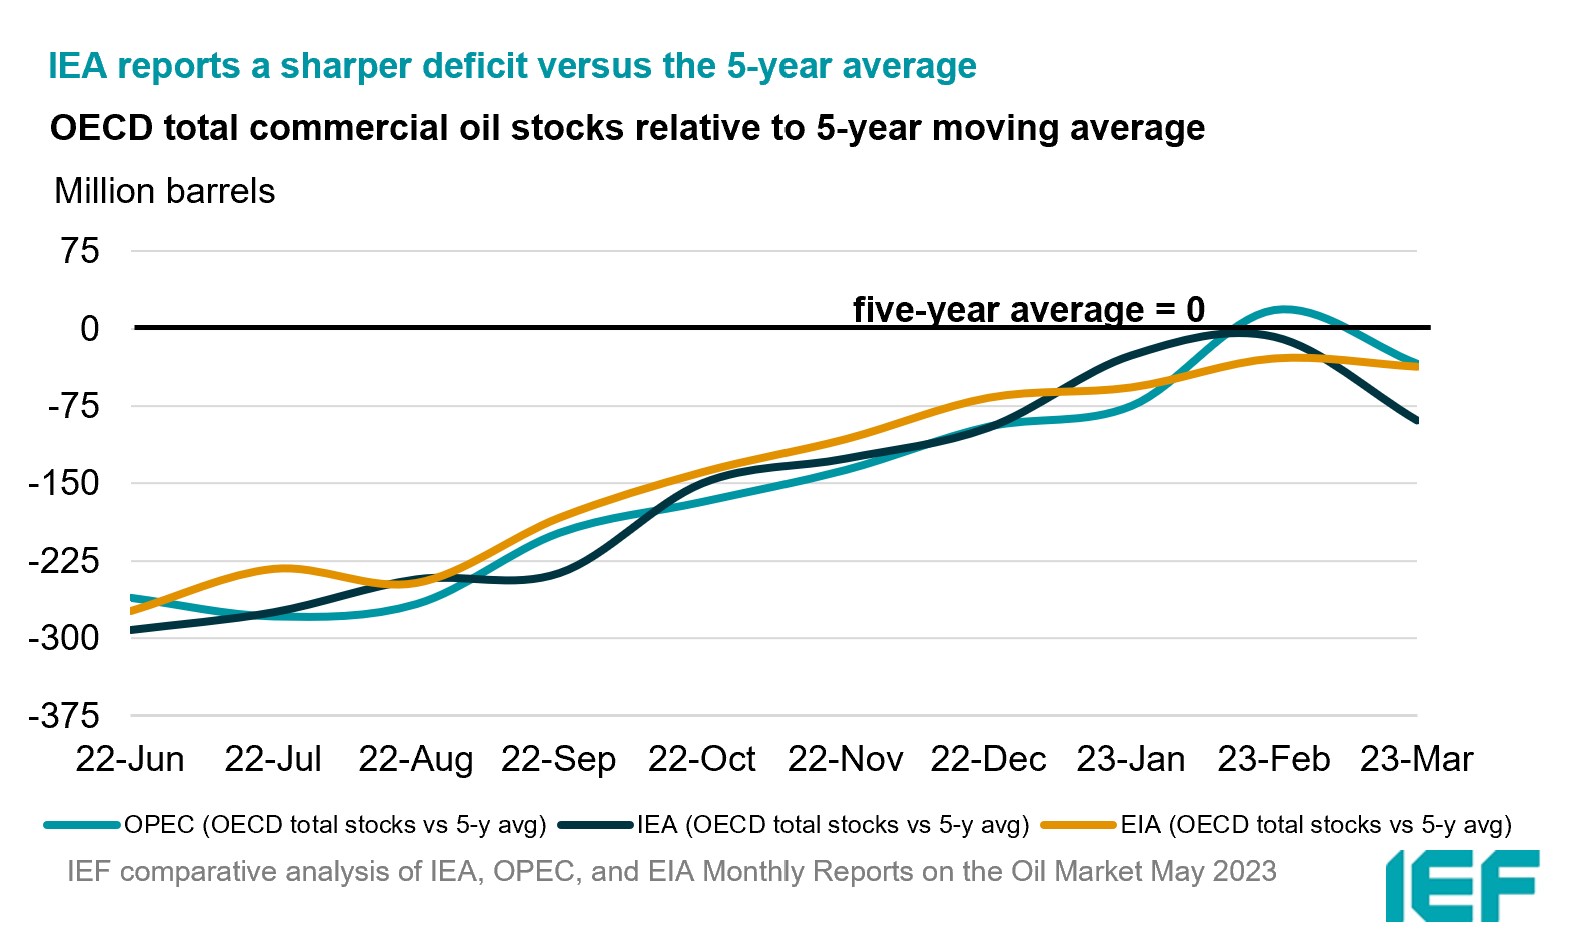
The IEA, OPEC, and EIA continue to display alignment on stock figures with inventories back below the five-year average, and all agencies see 60 or more days of forward cover.
- The IEA reports OECD stock levels at 2753 mb, which is close to OPEC's assessment of 2808 mb and the EIA's assessment of 2804 mb. These are around 89 mb below, 34 mb below, and 37 mb below the five-year average, respectively.
- According to the IEA, crude oil inventories built by 1.6 mb while product stocks drew by 51.5 mb. Other oils, including NGLs and feedstocks drew by 6.5 mb. According to OPEC, crude oil stocks drew by 4.9 mb while products drew by 26.8 mb.
- The widest divergence in inventories is between the OPEC and the EIA at 55 mb. Total US crude inventories (excluding SPR) amount to about 463 mb, according to the EIA, which is 1 percent below the five-year average for this time of year.
2.4 SNAPSHOT (mb/d)
3. Global Analysis
Explanatory Note
The IEF conducts a comprehensive comparative analysis of the short-, medium-, and long-term energy outlooks of the IEA, OPEC, and the EIA to inform the IEA-IEF-OPEC Symposium on Energy Outlooks that the IEF hosts in Riyadh as part of the trilateral work programme on a yearly basis.
To inform IEF stakeholders on how perspectives on the oil market of both organisations evolve over time regularly, this monthly summary provides:
- An overview of key events and initiatives in the international policy and market context.
- Key findings and a snapshot overview of data points gained from comparing basic historical data and short-term forecasts of the IEA Oil Market Report, the OPEC Monthly Oil Market Report, and the EIA Short-term Energy Outlook.
- A comparative analysis of oil inventory data reported by the IEA, OPEC, and EIA, and secondary sources in collaboration with Kayrros (added in an updated report on the IEF website).
The International Energy Forum
The International Energy Forum is the leading global facilitator of dialogue between sovereign energy market participants. It incorporates members of International Energy Agency and the Organization of the Petroleum Exporting Countries, and also key players including China, India, Russia and South Africa. The forum's biennial ministerial meetings are the world's largest gathering of energy ministers, where discussions focus on global energy security and the transition towards a sustainable and inclusive energy future. The forum has a permanent secretariat of international staff based in the Diplomatic Quarter of Riyadh, Saudi Arabia. For more information visit www.ief.org.