Comparative Analysis of Monthly Reports on the Oil Market
1. International Policy and Market Context
20th Meeting of the Joint Ministerial Monitoring Committee
- On 15 July, OPEC + members agreed to ease production adjustments by moving forward with the planned adjustment of 7.7 million barrels a day from the market in August compared with cuts of 9.7 million over the last three months. There will also be additional compensatory adjustments by members who were not able to fulfill earlier commitments.
First Global Inventory Draws
- According to the IEA, floating storage of crude oil fell by 34.9 mb in June from its all-time high in May to 176.4 mb. A tightening crude market balance and flatter forward price curves are reducing the incentive to store oil. According to the US EIA, global markets have shifted from a 21 mb/d of oversupply in April to inventory draws in June.
COVID-19 Stimulus and Recovery Measures
- To mitigate the economic effects of COVID-19, several countries are proposing a range of measures including green stimulus packages that promote sustainable energy production and policy support for renewables. This also includes additional investments in electric and hydrogen vehicles.
EU Hydrogen Strategy
- On 8 July, the European Commission unveiled its hydrogen strategy to help the EU achieve carbon neutrality by 2050. The aim of the strategy is to boost and gradually decarbonise hydrogen production. This will be made possible by the rapid decline in the cost of renewable energy and acceleration of technology developments. This “green” hydrogen can have several applications in overall decarbonisation efforts. (See IEF Insight Brief on The Role of Hydrogen in Sustainable Growth).
2. Key Points
2.1 Demand
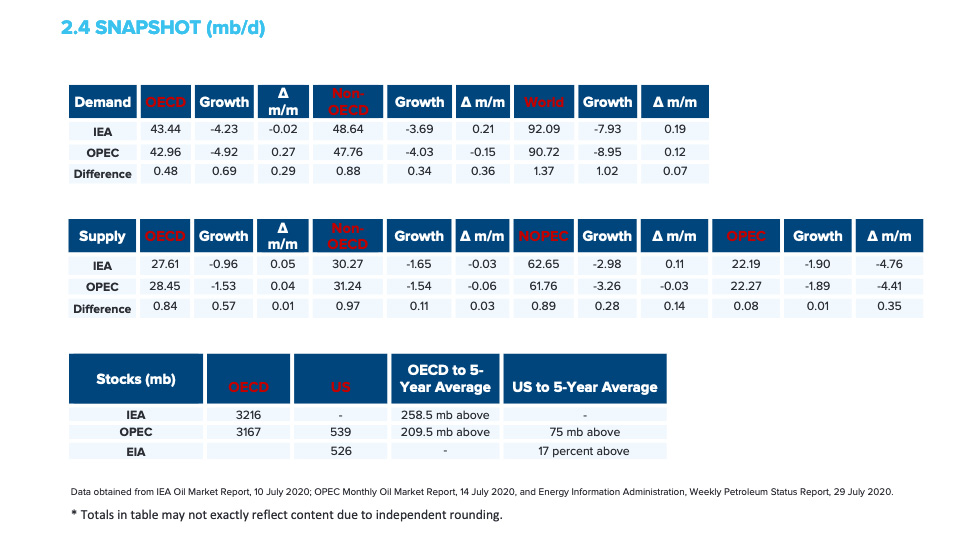
Both the IEA and OPEC report demand increases in July.
- The IEA's world demand assessments increased by 180 kb/d to reach an overall demand decline of -7.93 mb/d – marginally less than last month’s supply decline of -8.11 mb/d.
- OPEC's demand forecast also moved up 120 kb/d for an overall demand decline of -8.95 mb/d. The IEA and OPEC estimates for absolute world demand are now 92.09 mb/d and 90.72 mb/d, respectively.
The IEA and OPEC converge on OECD demand decline while diverging slightly on non-OECD decline compared to last month.
- The IEA's OECD demand assessment decreased by 20 kb/d for a total demand decline of -4.23 mb/d, while OPEC reports an increase of 270 kb/d for an overall decline of -4.92 mb/d.
- The IEA's estimate for non-OECD demand increases by 210 kb/d to reach a total decline of -3.69 mb/d for 2020. OPEC’s estimate decreases by 150 kb/d to reach a demand decline of -4.03 mb/d.
- The IEA and OPEC differ by 0.88 kb/d and 0.48 kb/d on absolute non-OECD and OECD demand, respectively.
2.2 Supply
The IEA's overall supply projections move up slightly in July while OPEC reports a marginal drop.
- The IEA's July assessment for non-OPEC supply is up by 110 kb/d to reach a total decline of -2.98 mb/d while OPEC’s assessment drops by 30 kb/d for a total decline of -3.26 mb/d. In absolute values, the IEA and OPEC estimate non-OPEC supply at 62.65 mb/d and 61.76 mb/d respectively for 2020.
- The IEA reports OECD supply decline at -0.96 mb/d, up by 50 kb/d. OPEC records OECD decline at -1.53 mb/d, an increase of 40 kb/d from last month. In absolute values, the IEA and OPEC estimate OECD supply estimates at 27.61 mb/d and 28.45 mb/d, respectively.
Both the IEA and OPEC report a slight decrease to non-OECD supply in July.
- The IEA's supply assessment decreased by 30 kb/d for a total decline of -1.65 mb/d while OPEC revised its assessment up by 60 kb/d to reach -1.54 mb/d
- In absolute values, the IEA and OPEC non-OECD supply estimates are 30.27 mb/d mb/d and 31.24 mb/d respectively for 2020.
Both the IEA and OPEC report decreases in OPEC production as OPEC+ production adjustments continued into June including additional voluntary adjustments.
- The IEA revised its OPEC production by 1.90 mb/d month-on-month (m-o-m) in June to reach total production of 22.19 mb/d.
- OPEC also reported a similar decrease by 1.89 mb/d m-o-m for total production of 22.27 mb/d in June.
2.3 Stocks
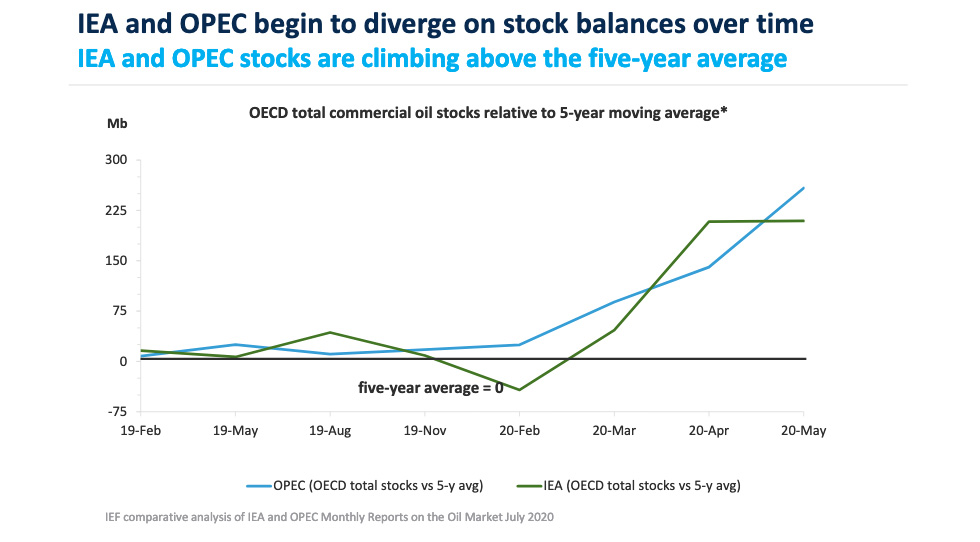
The IEA and OPEC continue to report strong alignment on stock figures. The IEA reports OECD stock levels at 3216 mb, which is close to OPEC’s assessment of 3167 mb for OECD stock that is 258.5 mb and 209.5 mb above the five-year average, respectively. The divergence between OPEC and the IEA stands at 49 mb for July. Total US crude inventories (excluding SPR) amount to about 537 mb according to the US Energy Information Administration (EIA). The EIA reports U.S. crude oil inventories are 19 percent above the five-year average for this time of year. OPEC reports US commercial crude stocks at 539 mb that are above the five-year average by about 75 mb.
2.4 Snapshot (mb/d)
3. Global Analysis
3.1 Demand Data
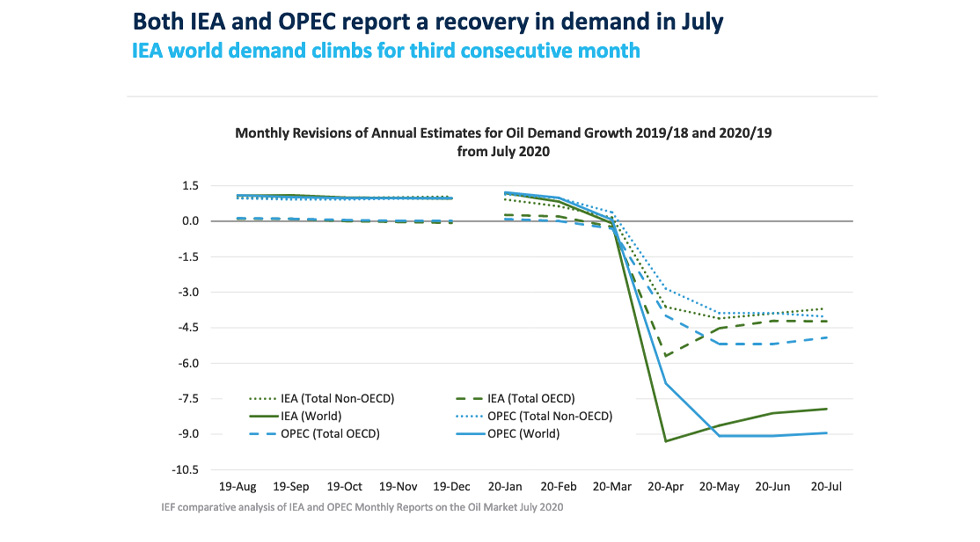
See the graph below for the monthly revisions of IEA and OPEC annual estimates for 2019 and new estimates for 2020 demand.
*monthly estimates rounded to the nearest barrel
Absolute Demand
- The IEA's estimate for global demand growth increased to -7.93 mb/d for an absolute demand of 92.09 mb/d in 2020. Although the demand decline has decreased since April, demand in 2020 will continue to depend on the course and extent of COVID-19.
- As the traditional driver of demand growth, non-OECD Asia demand has been revised up from -1.81 mb/d to -1.64 mb/d in July according to the IEA.
- OPEC's global demand increased slightly for a total decline of -8.95 mb/d in 2020. Absolute demand is below the 100 mb/d mark at 90.72 mb/d.
- Global demand is expected to decline by 7.9 mb/d in 2020 and recover by 5.3 mb/d in 2021.
OECD Demand
- The IEA reports OECD oil demand decline at -4.23 mb/d, down slightly from last month’s figure of -4.21 mb/d with the Americas comprising most of the decrease at -2.34 mb/d. The IEA anticipates total OECD consumption for 2020 at 43.38 mb/d.
- OPEC's demand projection for the OECD region remains the same as last month with a demand decline of -5.19 mb/d with total OECD demand for 2020 at 43.44 mb/d.
Non-OECD Demand
- The IEA and OPEC anticipate declines in non-OECD demand for this year at -3.69 mb/d and -4.03 mb/d, respectively. This is driven largely by Asia, Middle East, and the Americas. Total non-OECD demand forecasts average 48.64 mb/d and 47.76 mb/d, respectively.
China Demand
- Demand increased in May due to strong refinery runs and a decline in oil product exports according to the IEA. Gasoline rose as well and this trend is expected to continue, however it is dependent on the recurrence of COVID-19 cases. Jet fuel and kerosene consumption continue to fall as international flights to and from China remain limited. Overall demand in 2020 will be 13.5 mb/d but is expected to rise by 710 kb/d in 2021.
- According to OPEC, demand showed some recovery in May as compared to April. Vehicle sales rose by 13 percent year-on-year (y-o-y) marking the highest gain since early 2018. Demand for petrochemicals feedstocks, including LPG and naphtha, and oil products such as fuel oil also increased. Overall demand in 2020 will drop by 0.95 mb/d but is expected to recover by 1.10 mb/d in 2021.
India Demand
- Indian oil demand was down by 540 kb/d y-o-y in June which was an improvement from May’s decline of 1.05 mb/d y-o-y as reported by the IEA. A re-emergence of COVID-19 is forcing some states to re-impose lockdown measures. Overall, Indian demand is expected to drop by 445 kb/d in 2020 with a recovery by 465 kb/d in 2021.
- According to OPEC, India’s oil demand increased by 1.1 mb/d month-on-month (m-o-m) in May due to easing lockdown restrictions and slow economic recovery, but this is dependent on the extent and severity of the COVID-19 outbreak in India. Meanwhile LPG demand is expected to rise in 2020 due to growth in residential gas demand while gasoline and diesel are projected to decline. Overall demand for 2020 will decline by 0.54 mb/d in 2020 and recover by 0.74 mb/d in 2021.
3.2 Supply Data
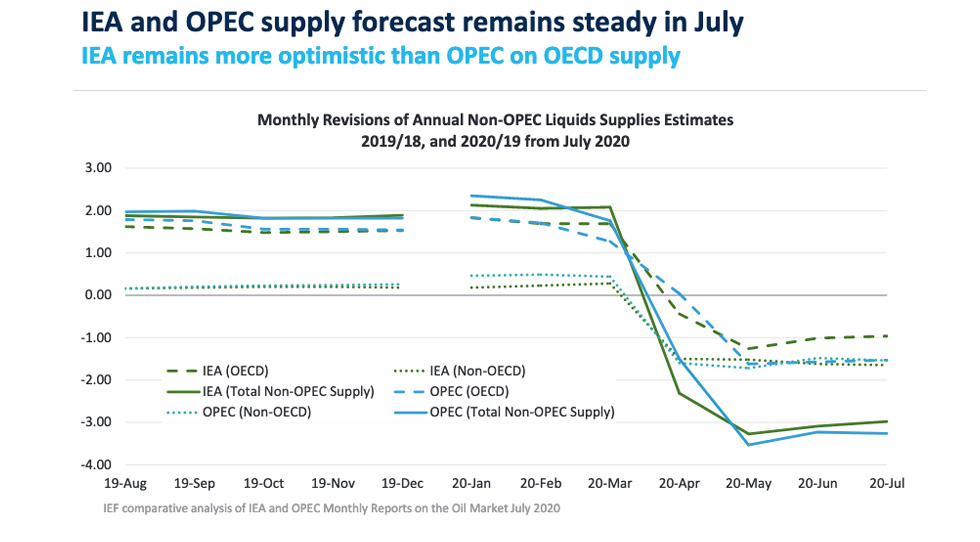
See the graph below for the monthly revisions of IEA and OPEC annual estimates for 2019 and new estimates for 2020 supply.
*monthly estimates rounded to the nearest barrel.
Non-OPEC Supply
- The IEA forecasts non-OPEC supply at 62.65 mb/d with a supply decline of -2.98 mb/d for 2020, an uptick of 110 kb/d compared to last month. In 2021, non-OPEC production will see a modest demand recovery of 0.74 mb/d.
- OPEC's July assessment of total non-OPEC supply for 2020 stands at 61.76 mb/d. Supply growth decreases by 30 kb/d with a total decline of -3.26 mb/d. Most of the decrease comes from the US (-1.37 mb/d), Russia (-1.13 mb/d), and Canada (-0.43 mb/d). Norway, Brazil, and Guyana are forecast to be the key drivers of growth.
OECD Supply
- The IEA forecasts OECD supply decline at -0.96 mb/d for 2020 while OPEC reports a slightly larger decline at -1.53 mb/d with total supply reaching 27.61 mb/d and 28.45 mb/d respectively in 2020.
- The IEA's data also shows OECD Americas oil supply declines by -1.27 mb/d to reach 23.43 mb/d in total. OPEC reports a larger decline at -1.84 mb/d with total oil supply reaching 23.90 mb/d in 2020.
- The IEA's assessment for OECD Europe supply records an increase by 0.27 mb/d for lower total production of 3.61 mb/d led primarily by Norway. OPEC’s assessment for total OECD Europe production in 2020 is 3.98 mb/d with a growth of 0.27 mb/d.
OPEC Supply
- The IEA reports that OPEC production decreased by -1.90 mb/d m-o-m in June to reach total production of 22.19 mb/d as OPEC+ production adjustments continued into June including additional voluntary adjustments.
- OPEC reports that total OPEC-13 crude oil production averaged 22.27 mb/d in June according to secondary sources. This is a decrease of -1.89 mb/d m-o-m as production adjustments continue along with additional voluntary adjustments. Crude oil output in June decreased in Saudi Arabia, Iraq, Venezuela, UAE, and Kuwait, while production increased in Equatorial Guinea and Libya.
3.3 Stock Data
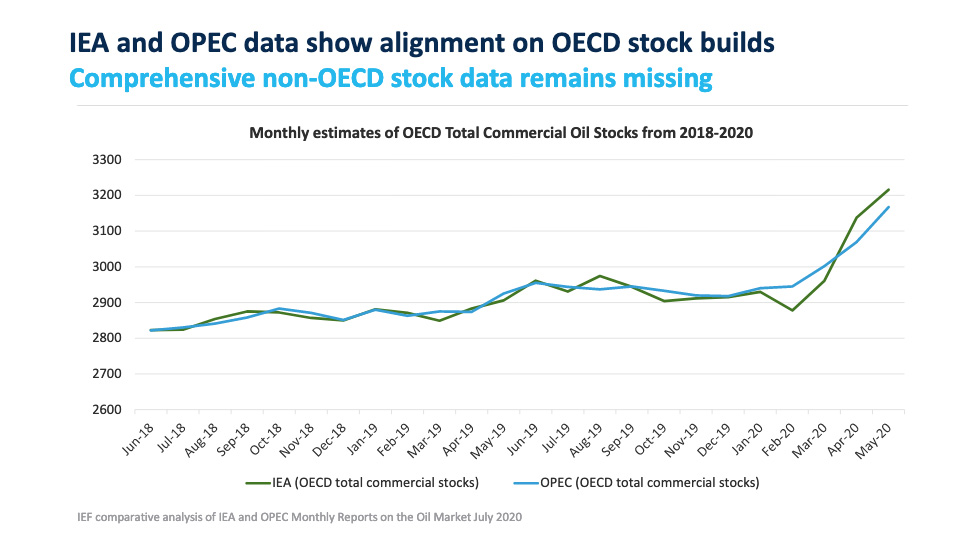
- IEA data shows OECD commercial inventories rose by 81.7 mb m-o-m in May to 3216 mb and are 258.5 mb above the five-year average.
- According to OPEC, preliminary data for May showed that total OECD commercial oil stocks rose by 29.9 mb m-o-m to 3167mb and are now 209.5 mb above the latest five-year average.
- While both organisations report closely aligned data on OECD stocks due to a continuous and reliable data stream and data harmonisation efforts, comprehensive data on stock developments for non-OECD countries is still work in progress.
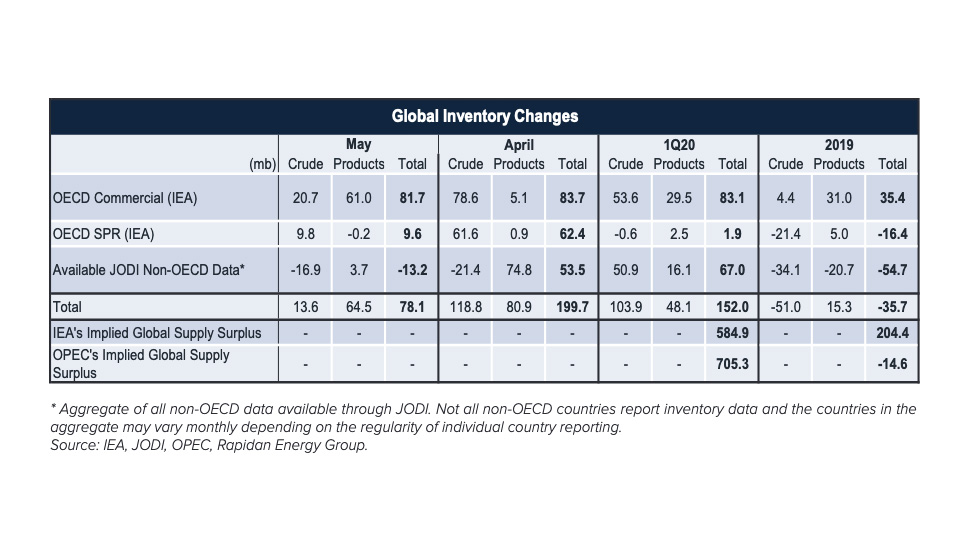
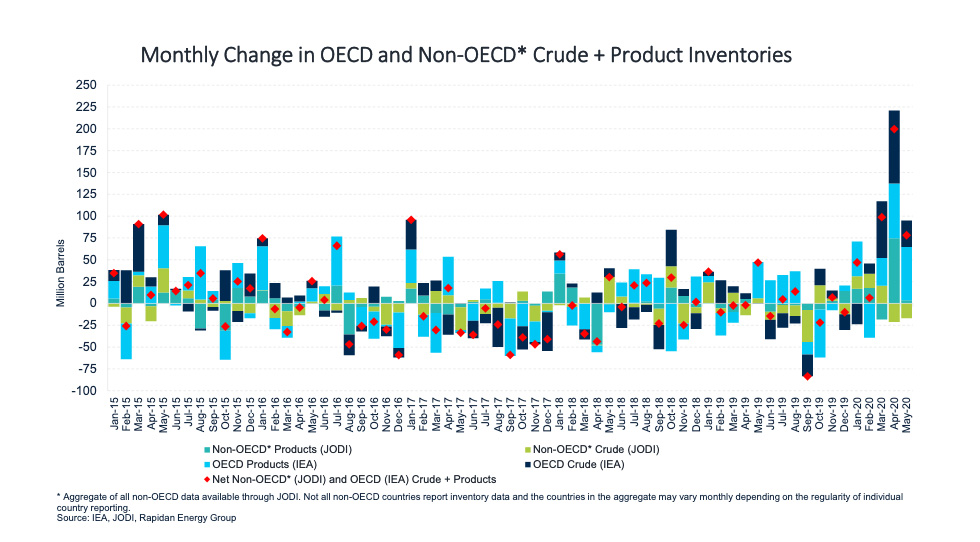
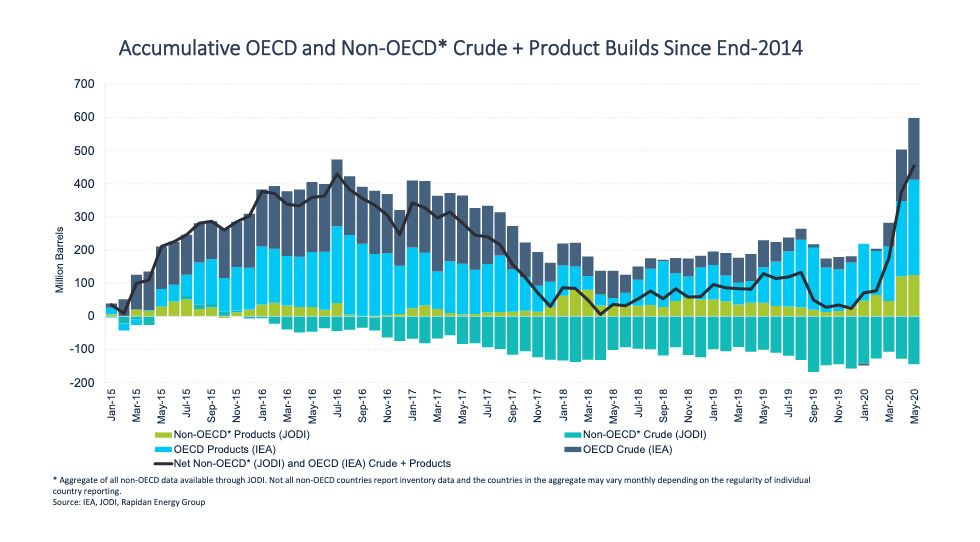
IEA and JODI inventory data imply crude and product stocks surged by 78.1 mb in May and ~430 mb over the first five months of the year
- IEA estimates OECD inventories climbed sharply by 81.7 mb in May to 258.5 mb above the latest 5-year average at 3,216 mb. OPEC estimates a much smaller build in OECD inventories in May with only a 29.9 mb increase to 3,167 mb (210 mb above the five-year average). OPEC estimates smaller builds across all OECD regions with the largest divergence in OECD Asia Pacific (OPEC’s 7.9 mb vs. IEA’s 27.3 mb).
- JODI non-OECD* data for May imply crude stocks drew by 16.9 mb and product stocks built by 3.7 mb. Crude draws primarily occurred in China (-6.4 mb), Algeria (-3.5 mb), and Taiwan (-3.5 mb). Product builds in China (6.3 mb) were partially offset by draws in Saudi Arabia (-3.7 mb).
- Updated and more complete JODI data for April shows a significant upward revision to preliminary stock change data. Originally, JODI data showed a ~33.8 mb crude and product draw across reporting non-OECD countries. Updated data now shows a 53.5 mb build driven by significant product builds in India.
- IEA's OECD and JODI's non-OECD* inventory data imply global crude and product stocks built by 78.1 mb in May and 429.8 mb year-to-date through May. However, it is worth noting a striking divergence in China’s reported crude stock builds in JODI and IEA’s estimate of implied Chinese crude builds. JODI shows China crude stocks drew by 6.4 mb in May and drew by a net 1.9 mb January through May. However, IEA’s crude balance implies a Chinese crude stocks built by a massive 40.6 mb in May and built by a net 220.8 mb January through May.
* Non-OECD data is the aggregate of country-level data through JODI. Not all non-OECD countries report inventory data and the countries in the aggregate may vary monthly depending on regularity of individual country reporting.
Explanatory Note
The IEF conducts a comprehensive comparative analysis of the short-, medium-, and long-term energy outlooks of the IEA and OPEC, to inform the IEA-IEF-OPEC Symposium on Energy Outlooks that the IEF hosts in Riyadh as part of the trilateral work programme on a yearly basis.
To inform IEF stakeholders on how perspectives on the oil market of both organisations evolve over time regularly, this monthly summary provides:
- An overview of key events and initiatives in the international policy and market context.
- Key findings and a snapshot overview of data points gained from comparing basic historical data and short-term forecasts of the IEA Oil Market Report and the OPEC Monthly Oil Market Report.
- A comparative analysis of oil inventory data reported by JODI, the IEA, OPEC, the US EIA and secondary sources in collaboration with the Rapidan Energy Group.
The International Energy Forum
The IEF is the neutral facilitator of informal, open, informed and continuing global energy dialogue. Covering all six continents, the IEF is unique in that it comprises not only countries of the IEA and OPEC, but also key players including China, India, Mexico, Russia and South Africa. The Forum’s biennial Ministerial Meetings are the world’s largest gathering of Energy Ministers. Through the Forum and its associated events, IEF Ministers, their officials, energy industry executives, and other experts engage in a dialogue of increasing importance to global energy security and orderly energy transitions. The IEF and the global energy dialogue are promoted by a permanent Secretariat of international staff based in the Diplomatic Quarter of Riyadh, Saudi Arabia. For more information visit www.ief.org.


