")

Comparative Analysis of Monthly Reports on the Oil Market
1. International Policy and Market Context
Joint Ministerial Monitoring Committee Reiterates Conformity
- The 22nd Meeting of the Joint Ministerial Monitoring Committee (JMCC) took place on 17 September 2020. The committee welcomed the compliance of OPEC and non-OPEC countries participating in the Declaration of Cooperation that reached 102 percent in August 2020. The JMMC also recommended to the OPEC and non-OPEC Ministerial Meeting the request of several underperforming member countries to extend the compensation period until the end of December 2020.
Oil Demand Falls Due To COVID-19 Resurgence
- Demand sentiment weakened according to both the IEA and OPEC as they report the largestdrop in global demand since April and May, respectively. IEA lowered its forecast by 350 kb/dand OPEC lowered its assessment by 400 kb/d. Although the intensity of COVID-19 is slowing insome countries, it is rising in others adding uncertainty to demand outlooks.
US Gulf Coast Hurricanes Limit Supply
- More than 30 percent of US Gulf crude and 25 percent of natural gas output remains offline due to Hurricane Sally which has impacted the US Gulf Coast. This comes less than a month after hurricane Laura shuttered 1.5 mb/d or 85 percent of Gulf oil production and 2.3 mb/d of refining capacity making it the busiest Atlantic hurricane season since 2005.
Oil Inventory Data
- IEA estimates July OECD commercial inventories rose by 13.5 mb month-on-month (m-o-m) to 3,225 mb and stood 255.7 mb above the five-year average. According to OPEC, preliminary data for July showed that total OECD commercial oil stocks fell by 4.5 mb m-o-m to 3231 mb and are now 260.6 mb above the latest five-year average.
2. Key Points
2.1 Demand
Both the IEA and OPEC report demand decreases in September.
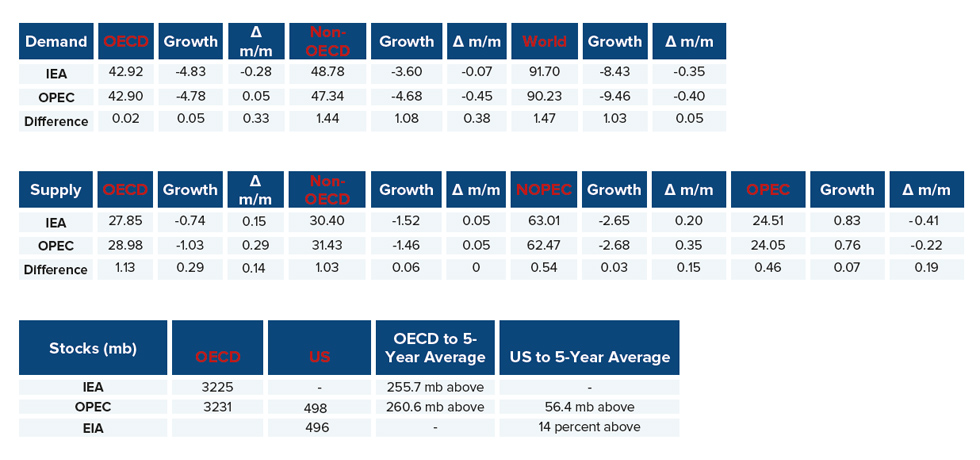
- The IEA reported a demand decrease by 350 kb/d and a year-on-year (y-o-y) demand decline of -8.43 mb/d due to uncertainty caused by COVID-19 in various countries.
- OPEC's demand forecast decreased by a similar margin at 400 kb/d for a y-o-y demand decline of -9.46 mb/d. The IEA and OPEC estimates for absolute world demand are now 91.70 mb/d and 90.23 mb/d, respectively.
The IEA and OPEC converge on OECD demand decline while diverging on non-OECD demand.
- The IEA's estimate for OECD demand decreases by 280 kb/d to reach a total decline of -4.83 mb/d for 2020. OPEC's estimate increases by 50 kb/d to reach a demand decline of -4.78 mb/d.
- The IEA's non-OECD demand assessment decreased by 70 kb/d for a total demand decline of -3.60 mb/d, while OPEC reports a decrease of 450 kb/d for an overall decline of -4.68 mb/d.
- The IEA and OPEC differ by 0.05 kb/d and 1.08 kb/d on OECD and non-OECD demand decline, respectively.
2.2 Supply
Both the IEA and OPEC's overall supply projections increase and converge in September.
- The IEA's September assessment for non-OPEC supply is up by 200 kb/d to reach a total decline of -2.65 mb/d while OPEC's assessment increases by 350 kb/d for a total decline of -2.68 mb/d. In absolute values, the IEA and OPEC estimate non-OPEC supply at 63.01 mb/d and 62.47 mb/d respectively for 2020.
- The IEA reports OECD supply decline at -0.74 mb/d, up by 70 kb/d. OPEC records OECD decline at -1.03 mb/d, an increase of 290 kb/d from last month. In absolute values, the IEA and OPEC estimate OECD supply estimates at 27.85 mb/d and 28.98 mb/d, respectively.
Both the IEA and OPEC post slight increases to non-OECD supply in September.
- The IEA's supply assessment increased by 50 kb/d for a total decline of -1.52 mb/d while OPEC also revised its assessment up by 50 kb/d to reach -1.46 mb/d. In absolute values, the IEA and OPEC non-OECD supply estimates are 30.40 mb/d and 31.43 mb/d respectively for 2020.
Both the IEA and OPEC report increases in OPEC production as quotas ease, led mainly by Saudi Arabia, Kuwait, and the United Arab Emirates.
- The IEA revised its OPEC production by 830 kb/d m-o-m in August to reach total production of 24.51 mb/d. OPEC also reported an increase by 760 kb/d m-o-m for total production of 24.05 mb/d in August.
2.3 Stocks
The IEA and OPEC continue to report strong alignment on stock figures. The IEA reports OECD stock levels at 3225 mb, which is close to OPEC's assessment of 3231 mb for OECD stock that is 255.7 mb and 260.6 mb above the five-year average, respectively. The divergence between OPEC and the IEA stands at 6 mb for September. Total US crude inventories (excluding SPR) amount to about 500 mb according to the US Energy Information Administration (EIA). The primary divergences between IEA and OPEC estimates were in Asia (total inventories +9.6 mb for IEA vs. -0.1 mb for OPEC) and the Americas (-7.2 mb vs. -12.3 mb). The EIA reports U.S. commercial crude oil inventories at 496 mb which are 14 percent above the five-year average for this time of year. OPEC reports US commercial crude stocks at about 498 mb which are around 56 mb above the five-year average.
2.4 Snapshot (mb/d)
Data obtained from IEA Oil Market Report, 15 September 2020; OPEC Monthly Oil Market Report, 14 September 2020, and Energy Information Administration, Weekly Petroleum Status Report, 16 September 2020.
* Totals in table may not exactly reflect content due to independent rounding.
3. Global Analysis
3.1 Demand Data
Figure 1
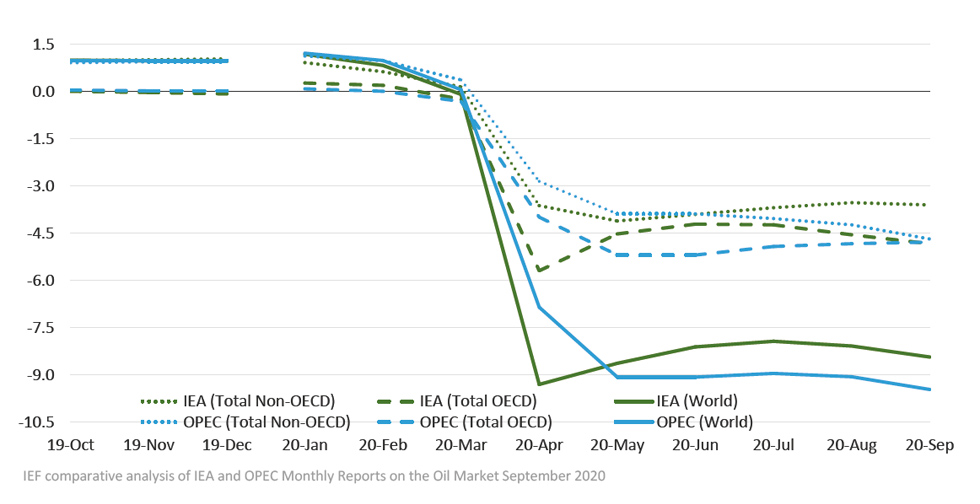
Both IEA and OPEC report slight decreases in demand
IEA and OPEC converge on OECD demand but disagree on Non-OECD demand
Absolute Demand
- The IEA' s estimate for global demand declined to -8.43 mb/d in September for an absolute demand of 91.70 mb/d in 2020. The 350 kb/d decrease is the largest drop in demand since April.
- As the traditional driver of demand growth, demand in non-OECD Asia dropped from -1.54 mb/d to -1.66 mb/d in September according to the IEA.
- OPEC's global demand assessment decreased by 400 kb/d for a total decline of -9.46 mb/d in 2020. Absolute demand is below the 100 mb/d mark at 90.23 mb/d.
- Global demand is expected to recover by 5.45 mb/d and 6.62 mb/d in 2021 according to the IEA and OPEC, respectively.
OECD Demand
- The IEA reports an OECD oil demand decline of -4.83 mb/d, down from last month's figure of -4.55 mb/d with the Americas comprising most of the decrease at -2.61 mb/d. The IEA anticipates total OECD consumption for 2020 at 42.92 mb/d.
- OPEC's demand projection for the OECD region increases by 50 kb/d to reach a demand decline of -4.78 mb/d with total OECD demand for 2020 at 42.90 mb/d.
Non-OECD Demand
- The IEA and OPEC anticipate declines in non-OECD demand for this year of -3.60 mb/d and -4.68 mb/d, respectively. This is driven largely by Asia, Middle East, and the Americas. Total non-OECD demand forecasts average 48.78 mb/d and 47.34 mb/d, respectively.
China Demand
- Overall demand in 2020 will be 13.59 mb/d, a decrease of 110 kb/d from last year but demand expected to rise by 710 kb/d in 2021 according to the IEA.
- Overall demand in 2020 will be 12.45 mb/d, a drop of 850 kb/d, but demand is expected to recover by 1.10 mb/d in 2021 according to OPEC.
India Demand
- According to the IEA, Indian demand is expected to drop by 510 kb/d in 2020 to reach a total demand of 4.60 mb/d with a recovery by 430 kb/d in 2021.
- Overall demand will decline by 800 kb/d with total demand of 4.04 mb/d in 2020. Demand will recover by 570 kb/d in 2021 according to OPEC.
3.2 Supply Data
Figure 2
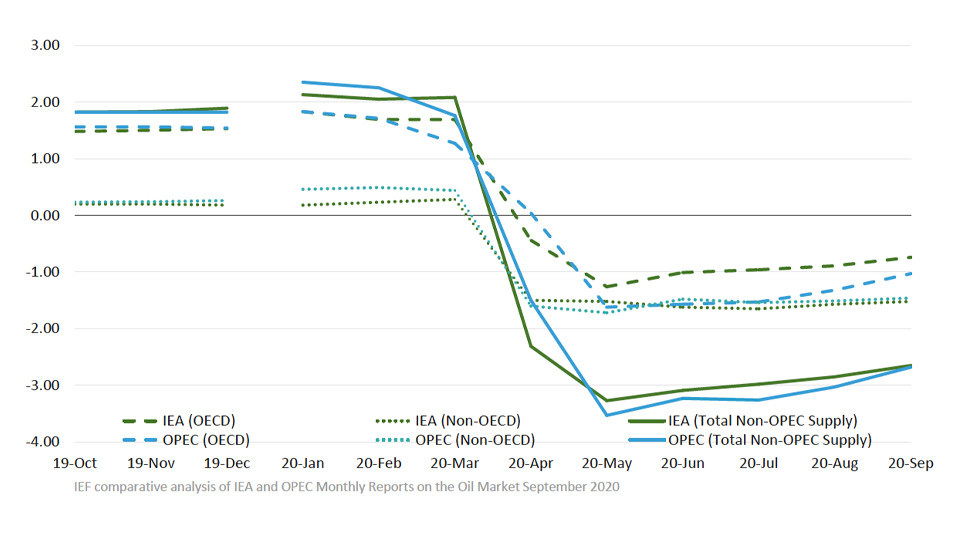
IEA and OPEC supply forecast rises and converges
IEA remains more optimistic than OPEC on OECD supply
Non-OPEC Supply
- The IEA forecasts non-OPEC supply at 63.01 mb/d with a supply growth of -2.65 mb/d for 2020, an increase of 200 kb/d compared to last month. In 2021, non-OPEC production will see a modest demand recovery of 470 kb/d.
- OPEC's September assessment of total non-OPEC supply for 2020 stands at 62.47 mb/d. Supply growth increases by 350 kb/d with a total decline of -2.68 mb/d. Most of the decrease comes from Russia (-1.12 mb/d), the US (-0.97 mb/d), and Canada (-0.32 mb/d). Norway, Brazil, and Guyana are forecast to be the key drivers of growth.
OECD Supply
- The IEA forecasts OECD supply decline at -0.74 mb/d for 2020 while OPEC reports a slightly larger decline at -1.03 mb/d with total supply reaching 27.85 mb/d and 28.98 mb/d respectively in 2020.
- The IEA's data shows that OECD Americas oil supply declines by 1.01 mb/d to reach 23.72 mb/d in total. OPEC reports a larger decline at -1.31 mb/d with total oil supply reaching 24.46 mb/d in 2020.
- The IEA's assessment for OECD Europe supply records an increase by 0.24 mb/d for total production of 3.58 mb/d led primarily by Norway. OPEC's assessment for total OECD Europe production in 2020 is 3.96 mb/d with a growth of 0.25 mb/d.
OPEC Supply
- The IEA reports that OPEC production increased by 830 kb/d m-o-m in August to reach total production of 24.51 mb/d as production increased in Saudi Arabia, Kuwait, and the UAE.
- OPEC reports that total OPEC-13 crude oil production averaged 24.05 mb/d in August according to secondary sources which is an increase of 763 kb/d m-o-m. Crude oil output increased in Saudi Arabia, the UAE, Kuwait, Algeria, and Angola while production decreased in Iraq.
3.3 Stock Data
- IEA data shows OECD commercial inventories rose by 13.5 mb m-o-m in July to 3225 mb and are 255.7 mb above the five-year average. Crude inventories increased counter-seasonally by 2.4 mb while product stocks grew by an additional 13.5 mb. Other oils, including NGLs and feedstocks, drew by 2.5 mb.
- According to OPEC, preliminary data for July showed that total OECD commercial oil fell by 4.5 mb m-o-m to 3231 mb and are now 260.6 mb above the latest five-year average. OPEC estimates crude stocks dropped by 9.7 mb while product stocks increased by 5.3 mb. The primary divergences between the IEA and OPEC estimates of were in OECD Asia. The IEA saw total inventories rise by +9.6 mb while OPEC observed a modest drop of -0.1 mb. OECD Americas inventories declined by -7.2 mb vs. -12.3 mb according to the IEA and OPEC respectively.
JODI Data:
- JODI non-OECD data for July imply crude stocks built by 9.2 mb and product stocks built by 23.5 mb. Crude builds primarily occurred in China (7.2 mb) and Angola (3.9 mb). Product builds occurred primarily in China (20.8 mb).
- The US crude oil closing stock level in July fell m-o-m by 14.18 mb to 1173.8 mb.
- Japanese crude oil stock level in June was revised downward by 9.87 mb and its July figure rose m-o-m by 7.13 mb to 385.31 mb.
- Korean crude oil closing stock level in July rose m-o-m by 7.58 mb 127.72 mb.
- UK total oil products closing stock level in July rose m-o-m by 175 kb to 52.56 mb.
While both the IEA and OPEC report closely aligned data on OECD stocks due to a continuous and reliable data stream and data harmonisation efforts, comprehensive data on stock developments for non-OECD countries is still work in progress as large differences in assessments show.
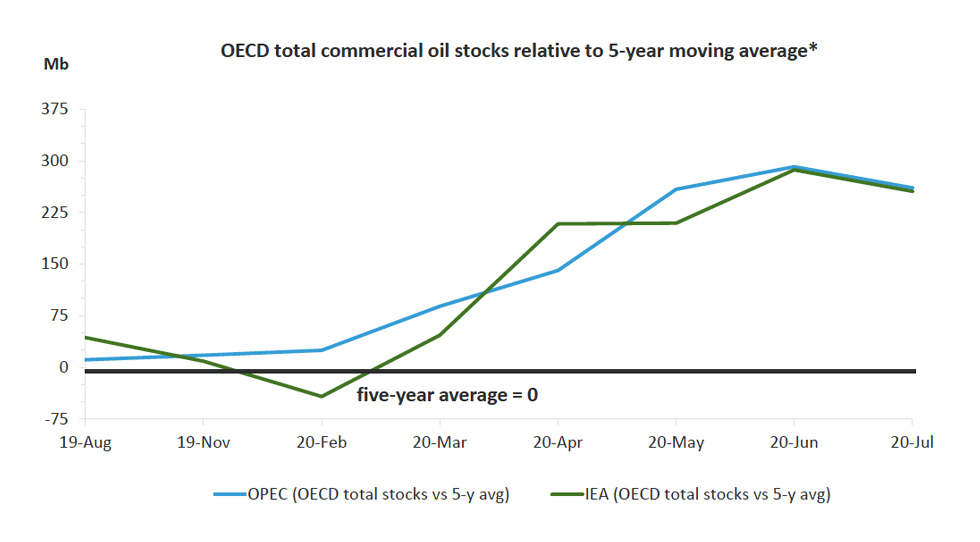
Figure 3
IEA and OPEC data show alignment on OECD stock builds
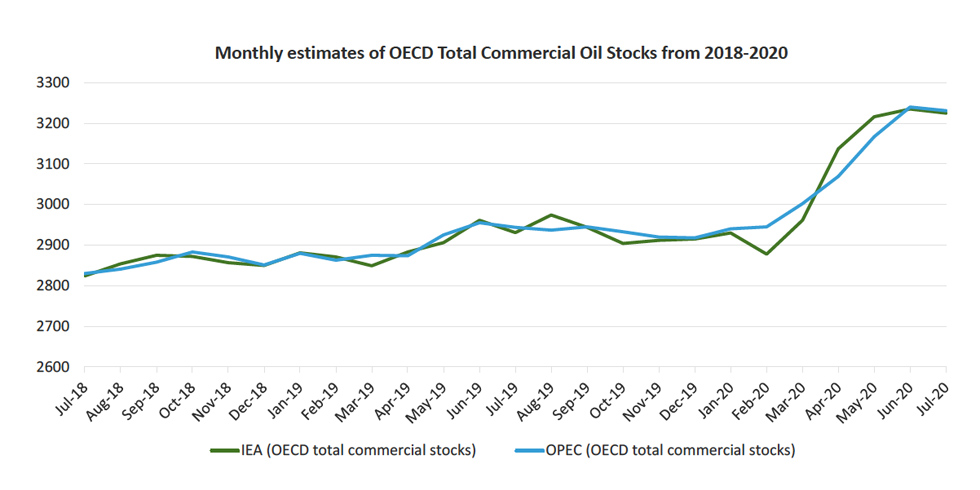
Figure 4
IEA and OPEC begin to converge on stock balances over time
IEA and OPEC stocks are climbing above the five-year average
3.3.1 Global Stock Analysis
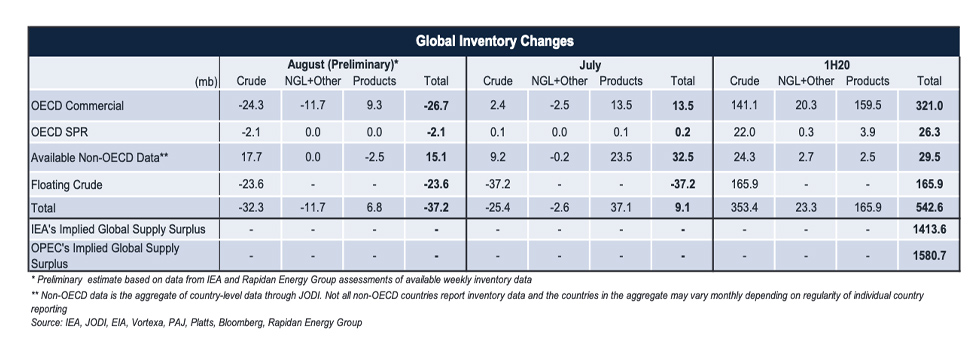
IEA, JODI, and floating inventory data imply crude, NGL, and product stocks climbed by 9.1 mb in July
- Floating crude inventories collapsed by 37.2 mb in July, nearly offsetting the onshore builds. Floating storage declines were driven by draws in Asia (-16.1 mb), US Gulf of Mexico (-10.4 mb), and Europe (-8.6 mb).
- The IEA's and OPEC's 1H20 global oil balances imply the market was oversupplied by ~1.4-1.6 billion barrels. Only ~21-25% of the oversupply appeared in OECD commercial and government inventory data. IEA's China crude balance implies another ~20% of 1H20's oversupply flowed into Chinese crude stocks. An additional ~20% appeared in floating crude data. And only ~2% is accounted for in available JODI non-OECD stock data.
- Rapidan Energy Group's preliminary global inventory estimate shows visible inventories dropped by 37.2 mb in August led by a 24.3 mb drop in OECD crude storage and another 23.6 mb decline in floating crude storage. Meanwhile, non-OECD crude inventories grew by 17.7 mb.
* Non-OECD data is the aggregate of country-level data through JODI. Not all non-OECD countries report inventory data and the countries in the aggregate may vary monthly depending on regularity of individual country reporting
Table 1
* Aggregate of all non-OECD data available through JODI. Not all non-OECD countries report inventory data and the countries in the aggregate may vary monthly depending on the regularity of individual country reporting. Source: IEA, JODI, OPEC, Rapidan Energy Group.
Figure 5
Figure 6
Explanatory Note
The IEF conducts a comprehensive comparative analysis of the short-, medium-, and long-term energy outlooks of the IEA and OPEC, to inform the IEA-IEF-OPEC Symposium on Energy Outlooks that the IEF hosts in Riyadh as part of the trilateral work programme on a yearly basis.
To inform IEF stakeholders on how perspectives on the oil market of both organisations evolve over time more regularly, this monthly summary provides:
- An overview of key events and initiatives in the international policy and market context.
- Key findings and a snapshot overview of data points gained from comparing basic historical data and short-term forecasts of the IEA Oil Market Report and the OPEC Monthly Oil Market Report.
- A comparative analysis of oil inventory data reported by JODI, the IEA, OPEC, the US EIA and secondary sources in collaboration with the Rapidan Energy Group.
The International Energy Forum
The IEF is the neutral facilitator of informal, open, informed and continuing global energy dialogue. Covering all six continents, the IEF is unique in that it comprises not only countries of the IEA and OPEC, but also key players including China, India, Russia and South Africa. The Forum's biennial Ministerial Meetings are the world's largest gathering of Energy Ministers. Through the Forum and its associated events, IEF Ministers, their officials, energy industry executives, and other experts engage in a dialogue of increasing importance to global energy security and orderly energy transitions. The IEF and the global energy dialogue are promoted by a permanent Secretariat of international staff based in the Diplomatic Quarter of Riyadh, Saudi Arabia. For more information visit www.ief.org.