")

Comparative Analysis of Monthly Reports on the Oil Market
1. International Policy and Market Context
Libya Restarts Oil Production
- Libya's oil industry, shut down since the beginning of the year, is reopening with output tripling to 300,000 barrels a day after the partial lifting of a blockade on energy facilities. Libya produced around 1.2 mb/d at the start of the year, before the blockade shut down most ports and fields.
US Gulf Coast Hurricanes Limit Supply
- Around 30 percent of Gulf of Mexico crude remains offline due to Hurricane Delta. At its peak on 10 October, the storm shut-in almost 2 mb/d of crude and 2 MMcf/d of gas production, respectively, representing 92 percent and 62 percent of total Gulf output. This is the fourth hurricane to impact Louisiana this year.
IEA and OPEC Differ on Long-Term Energy Outlooks
- According to OPEC's World Oil Outlook, global primary energy demand is forecast to continue growing in the medium- and long-term, increasing by a significant 25 percent in the period to 2045. Oil is expected to retain the largest share of the energy mix throughout the outlook period, accounting for a 27 percent share in 2045. According to the IEA’s World Energy Outlook, oil demand will continue to grow albeit at a slower pace and plateau in the 2030s. Coal's share of the energy mix will fall below 20 percent for the first time as renewables will become the primary means of producing electricity by 2025.
G20 Energy Ministerial Meeting Communique Highlights IEF Role
- G20 Energy Ministers meeting virtually on 27-28 September 2020 against the backdrop of the unprecedented impacts of the COVID-19 pandemic, invited the IEF to enhance dialogue and collaboration on the Circular Carbon Economy Accelerator, Energy Security, Market Stability and Investment, Enhance Data Transparency, and sharpen focus on short term issues in the G20 Energy Focus Group.
2. Key Points
2.1 Demand
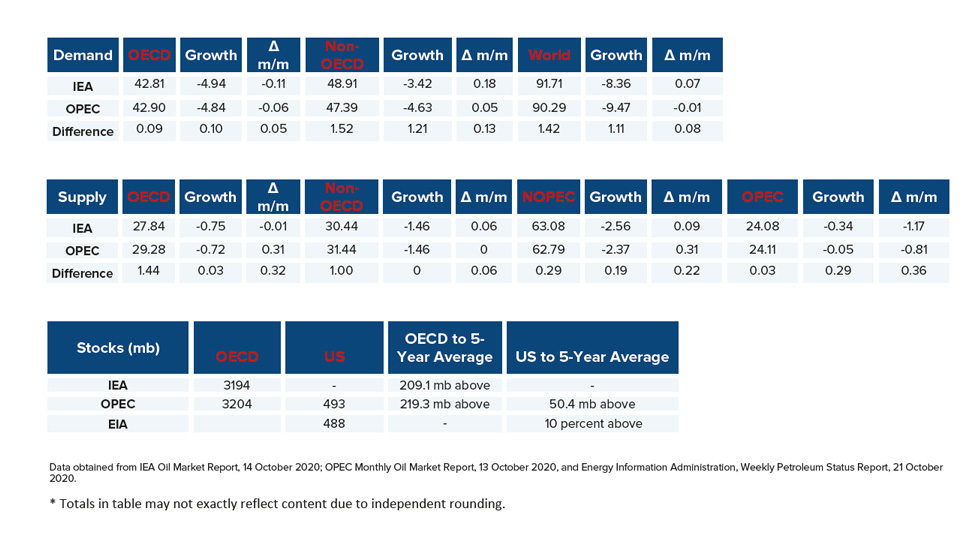
Demand remains stable according to both the IEA and OPEC.
- The IEA reported a demand increase of 70 kb/d and a year-on-year (y-o-y) demand decline of -8.36 mb/d due to uncertainty caused by COVID-19 in various countries.
- OPEC's demand forecast decreased by 10 kb/d for a y-o-y demand decline of -9.47 mb/d. The IEA and OPEC estimates for absolute world demand are now 91.71 mb/d and 90.29 mb/d, respectively.
The IEA and OPEC diverge on non-OECD demand.
- The IEA's estimate for OECD demand decreases by 110 kb/d to reach a total decline of -4.94 mb/d for 2020. OPEC's estimate decreases by 60 kb/d to reach a demand decline of -4.84 mb/d.
- The IEA's non-OECD demand assessment decreased by 180 kb/d for a total demand decline of -3.42mb/d, while OPEC reports an increase of 50 kb/d for an overall decline of -4.63 mb/d.
- The IEA and OPEC differ by 0.10 kb/d and 1.21 kb/d on OECD and non-OECD demand decline, respectively.
2.2 Supply
Both the IEA and OPEC's non-OPEC supply projections increase, and OPEC surpasses IEA estimates for the first time since April.
- The IEA's October assessment for non-OPEC supply is up by 90 kb/d to reach a total decline of -2.56 mb/d while OPEC's assessment increases by 310 kb/d for a total decline of -2.37 mb/d. In absolute values, the IEA and OPEC estimate non-OPEC supply at 63.08 mb/d and 62.79 mb/d respectively for 2020.
- The IEA reports OECD supply declines at -0.75 mb/d, down by 10 kb/d. OPEC records OECD declines at -0.72 mb/d, an increase of 310 kb/d from last month. In absolute values, the IEA and OPEC estimate OECD supply at 27.84 mb/d and 29.28 mb/d, respectively for 2020 diverging by 1.44 mb/d.
The IEA posts a slight increase to non-OECD supply while OPEC remains constant.
- The IEA's supply assessment increased by 60 kb/d for a total decline of -1.46 mb/d while OPEC remained the same at -1.46 mb/d. In absolute values, the IEA and OPEC non-OECD supply estimates are 30.44 mb/d and 31.44 mb/d respectively for 2020 diverging by 1 mb/d.
Both the IEA and OPEC report decreases in OPEC production to enhance compliance, led mainly by the United Arab Emirates.
- The IEA revised its OPEC production by 340 kb/d m-o-m in September to reach total production of 24.08 mb/d. OPEC also reported a decrease by 50 kb/d month-on-month (m-o-m) for total production of 24.11 mb/d in September.
2.3 Stocks
The IEA and OPEC continue to report strong alignment on stock figures. The IEA reports OECD stock levels at 3194 mb, which is close to OPEC’s assessment of 3204 mb for OECD stock that is 209.1 mb and 219.3 mb above the five-year average, respectively. The divergence between OPEC and the IEA stands at 10 mb. Total US crude inventories (excluding SPR) amount to about 488 mb according to the US Energy Information Administration (EIA) which are about 10 percent above the five-year average for this time of year. OPEC reports US commercial crude stocks at about 493 mb and around 50 mb above the five-year average.
2.4 Snapshot (mb/d)
3. Global Analysis
3.1 Demand Data
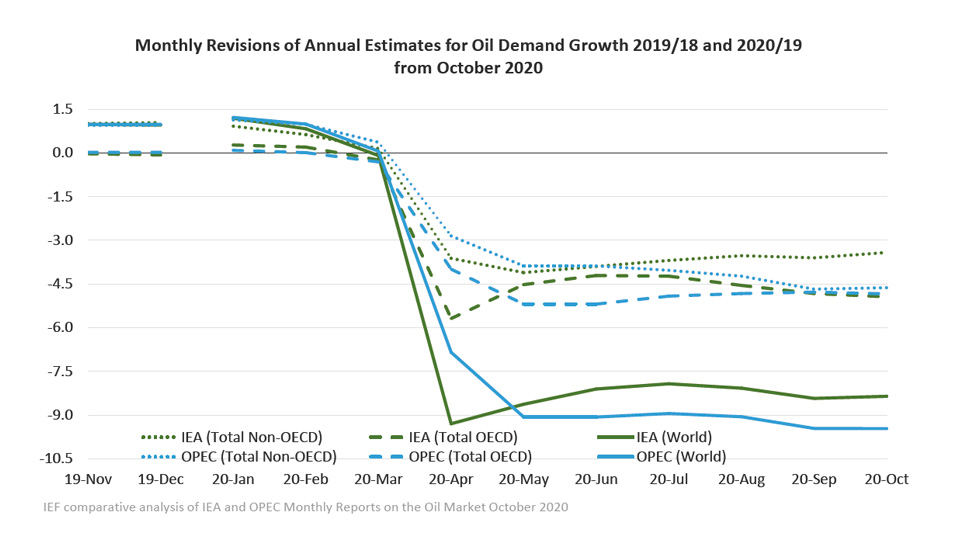
Figure 1
IEA and OPEC demand remains largely stable
IEA and OPEC Non-OECD demand diverges further
Absolute Demand
- The IEA's estimate for global demand declined to -8.36 mb/d in October for an absolute demand of 91.71 mb/d in 2020.
- As the traditional driver of demand growth, demand in non-OECD Asia increased from -1.66 mb/d to -1.50 mb/d in October according to the IEA.
- OPEC's global demand assessment decreased by 10 kb/d for a total decline of -9.47 mb/d in 2020. Absolute demand is below the 100 mb/d mark at 90.29 mb/d.
- Global demand is expected to recover by 5.49 mb/d and 6.54 mb/d in 2021 according to the IEA and OPEC, respectively.
OECD Demand
- The IEA reports an OECD oil demand decline of -4.94 mb/d, down from last month's figure of -4.83 mb/d with the Americas comprising most of the decrease at -2.70 mb/d. The IEA anticipates total OECD consumption for 2020 at 42.81 mb/d.
- OPEC's demand projection for the OECD region decreases by 60 kb/d to reach a demand decline of -4.84 mb/d with the Americas comprising most of the decrease at -2.45 mb/d for absolute 2020 demand at 42.90 mb/d.
Non-OECD Demand
- The IEA and OPEC anticipate declines in non-OECD demand for this year of -3.42 mb/d and -4.63 mb/d, respectively, diverging by 1.21 mb/d. This is driven largely by Asia, Middle East, and the Americas. Total non-OECD demand forecasts average 48.91 mb/d and 47.39 mb/d, respectively, diverging by 1.52 mb/d.
China Demand
- Overall demand in 2020 will be 13.68 mb/d, a decrease of 20 kb/d from last year but demand expected to rise by 730 kb/d in 2021 according to the IEA.
- Overall demand in 2020 will be 12.53 mb/d, a drop of 770 kb/d, but demand is expected to recover by 1.10 mb/d in 2021 according to OPEC.
India Demand
- According to the IEA, Indian demand is expected to drop by 510 kb/d in 2020 to reach a total demand of 4.60 mb/d with a recovery by 340 kb/d in 2021.
- Overall demand will decline by 800 kb/d with total demand of 4.04 mb/d in 2020. Demand will recover by 570 kb/d in 2021 according to OPEC.
3.2 Supply Data
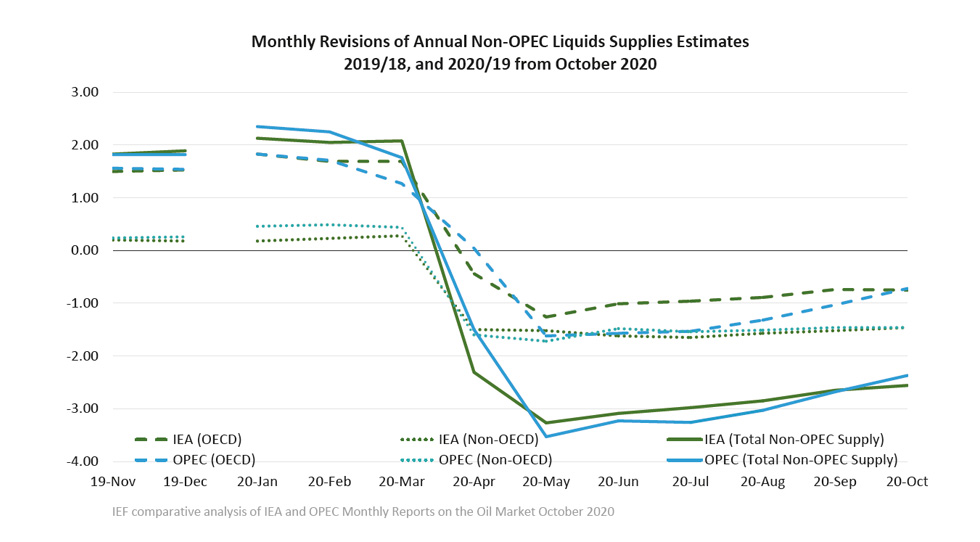
Figure 2
OPEC Non-OPEC supply surpasses the IEA estimate
OPEC converges with the IEA on OECD supply
Non-OPEC Supply
- The IEA forecasts non-OPEC supply at 63.08 mb/d with an adjusted supply drop of -2.56 mb/d for 2020, an increase of 90 kb/d compared to last month. In 2021, non-OPEC production will see a modest recovery of 440 kb/d.
- OPEC's October assessment of total non-OPEC supply for 2020 stands at 62.79 mb/d. Supply increases by 310 kb/d with a total decline of -2.37 mb/d. Most of the decline comes from Russia (-1.09 mb/d), the US (-0.65 mb/d), and Canada (-0.33 mb/d). Norway, Brazil, and Guyana are forecast to be the key drivers of growth.
OECD Supply
- The IEA forecasts OECD supplies to decline by -0.75 mb/d for 2020 while OPEC reports a similar decline at -0.72 mb/d with total supply reaching 27.84 mb/d and 29.28 mb/d respectively in 2020 and diverging by 1.44 mb/d.
- The IEA's data shows that OECD Americas oil supply declines by 1 mb/d to reach 23.73 mb/d in total. OPEC reports a similar decline at -1.01 mb/d with total oil supply reaching 24.77 mb/d in 2020.
- The IEA's assessment for OECD Europe supply records an increase by 230 kb/d for total production of 3.57 mb/d led primarily by Norway. OPEC’s assessment for total OECD Europe production in 2020 is 3.96 mb/d with a growth of 250 kb/d.
OPEC Supply
- The IEA reports that OPEC production decreased by 340 kb/d m-o-m in September to reach total production of 24.08 mb/d led by decreased production in the UAE.
- OPEC reports that total OPEC-13 crude oil production averaged 24.11 mb/d in September according to secondary sources which is a decrease of 50 kb/d m-o-m. Crude oil output increased in Libya, Iraq, and Saudi Arabia.
3.3 Stock Data
- IEA data shows OECD commercial inventories fell by 22.1 mb m-o-m in August to 3194 mb and are 209.1 mb above the five-year average. Crude inventories dropped by 25.1 mb while product stocks rose by 9.2 mb. Other oils, including NGLs and feedstocks, drew by 6.2 mb.
- According to OPEC, preliminary data for August showed that total OECD commercial oil fell by 20.7 mb m-o-m to 3204 mb and are now 219.6 mb above the latest five-year average. OPEC estimates crude stocks drew by 30.2 mb while product stocks increased by 9.4 mb.
JODI Data:
- The US crude oil closing stock levels fell by 27.87 mb m-o-m in August to 1147.5 mb.
- Japanese crude oil stocks rose 7.65 mb m-o-m in August to 388.89 mb.
- Korean crude oil closing stock levels fell by 3.94 mb m-o-m in August to 123.77 mb.
- German crude oil closing stock levels rose by 4.47 mb m-o-m in August to 155.6 mb.
- Having hit its 26-month high in July, UK crude oil closing stock levels fell by 2.12 mb m-o-m in August to 31.0 mb.
While both the IEA and OPEC report closely aligned data on OECD stocks due to a continuous and reliable data stream and data harmonisation efforts, comprehensive data on stock developments for non-OECD countries is still work in progress as large differences in assessments show.
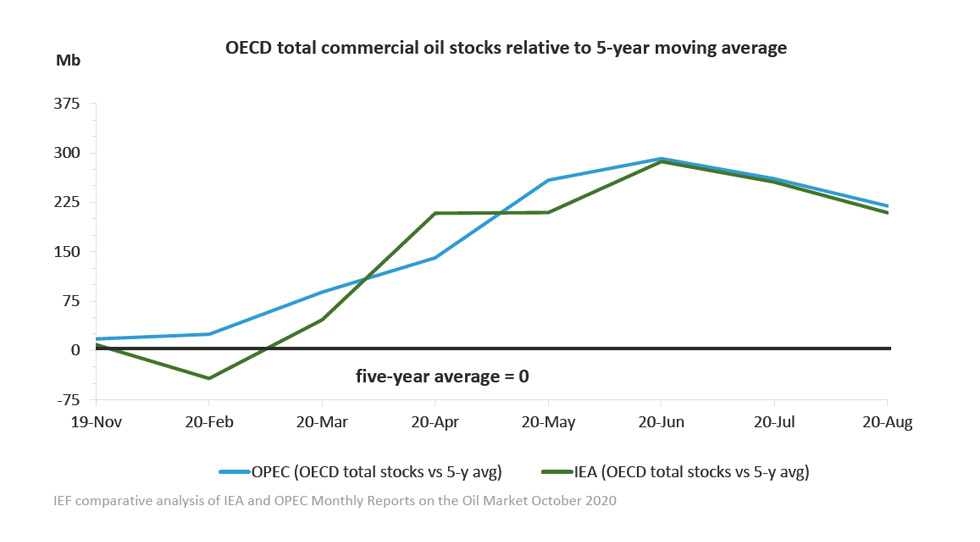
Figure 3
IEA and OPEC data show alignment on OECD stock builds
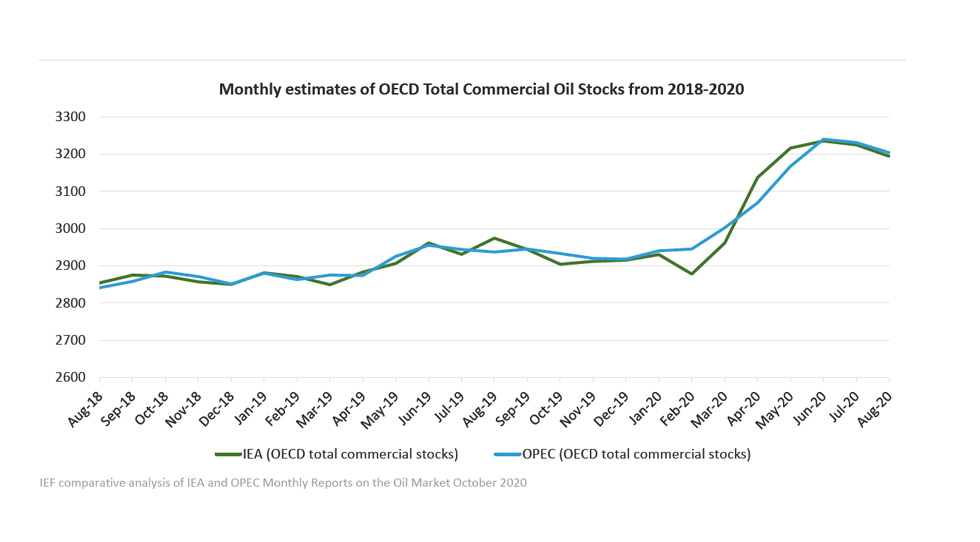
Figure 4
Stock decline rates by the IEA and OPEC converge
OECD stocks remain well above five-year average
3.3.1 Global Stock Analysis
IEA and available weekly inventory data imply crude, NGL, and product stocks fell by ~54.0 mb in August in the first monthly decline of the year.
- Floating crude inventories collapsed by 39.7 mb in August, driven by draws in Asia (-19.4 mb), Middle East (-8.1 mb), and US Gulf Coast (-5.4mb).
- Rapidan Energy Group's preliminary global inventory estimate for September shows visible inventories tumbled by an additional 84.7 mb led by a 77.7 mb drop in floating crude storage and a 10.8 mb decline in OECD commercial and SPR stocks. Meanwhile, non-OECD crude inventories grew by 10.8 mb.
- Preliminary data suggests 3Q20 global inventories drew by ~124 mb, led by a ~143 mb drop in floating crude and offsetting ~22% of 1H20's historic builds. This preliminary estimate falls between the agencies' implied supply deficits for 3Q20 of 211 mb (IEA) and 56 mb (OPEC).
- The IEA's and OPEC's 1H20 global oil balances continue to imply the market was oversupplied by ~1.4-1.5 billion barrels built up in storage. Only ~25% of the oversupply appeared in OECD commercial and government inventory data. IEA's China crude balance implies another ~20% of 1H20's oversupply flowed into Chinese crude stocks. An additional ~10% appeared in floating crude data. And only ~2% is accounted for in available JODI non-OECD stock data.
Table 1
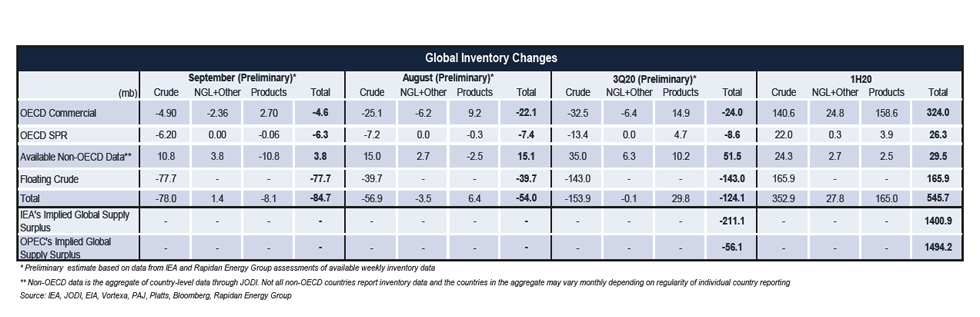
* Aggregate of all non-OECD data available through JODI. Not all non-OECD countries report inventory data and the countries in the aggregate may vary monthly depending on the regularity of individual country reporting. Source: IEA, JODI, OPEC, Rapidan Energy Group.
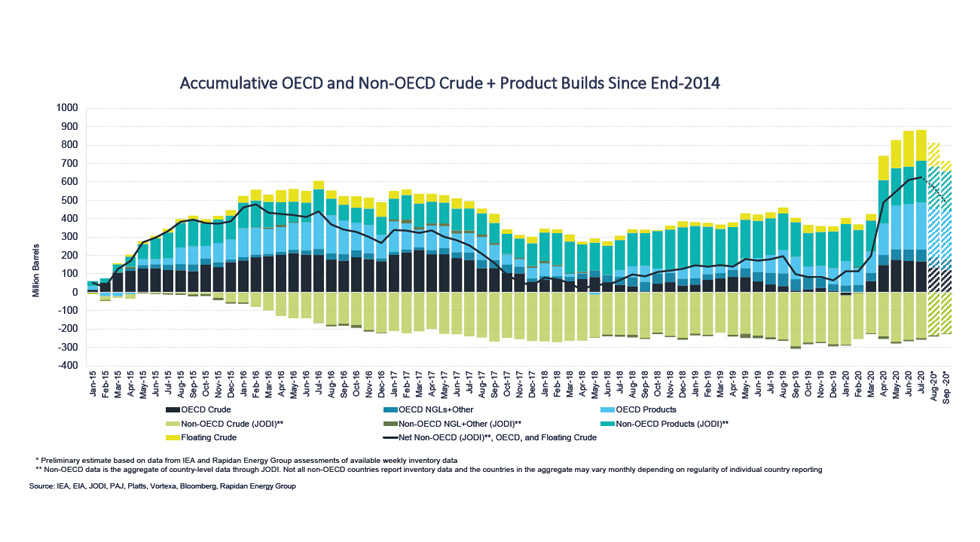
Figure 5
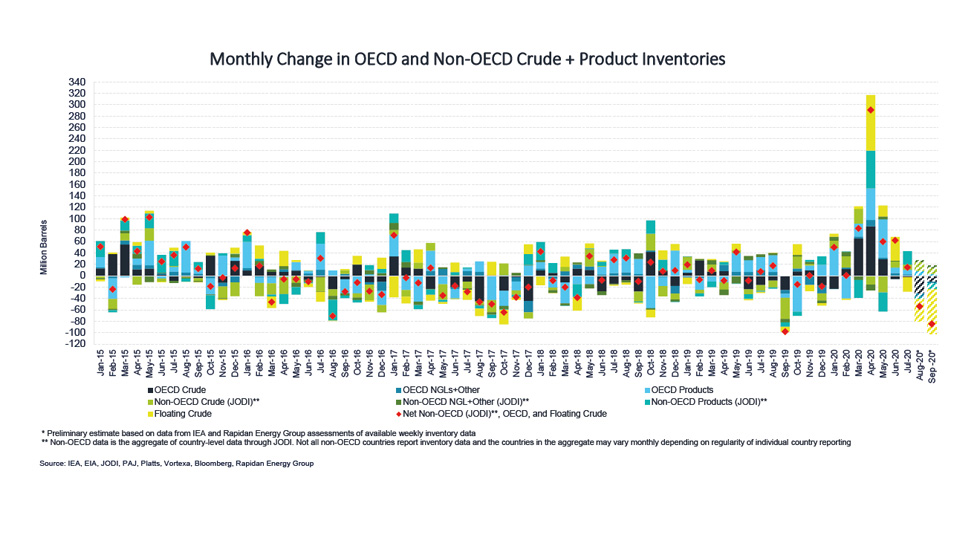
Figure 6
Explanatory Note
The IEF conducts a comprehensive comparative analysis of the short-, medium-, and long-term energy outlooks of the IEA and OPEC, to inform the IEA-IEF-OPEC Symposium on Energy Outlooks that the IEF hosts in Riyadh as part of the trilateral work programme on a yearly basis.
To inform IEF stakeholders on how perspectives on the oil market of both organisations evolve over time more regularly, this monthly summary provides:
- An overview of key events and initiatives in the international policy and market context.
- Key findings and a snapshot overview of data points gained from comparing basic historical data and short-term forecasts of the IEA Oil Market Report and the OPEC Monthly Oil Market Report.
- A comparative analysis of oil inventory data reported by JODI, the IEA, OPEC, the US EIA and secondary sources in collaboration with the Rapidan Energy Group.
The International Energy Forum
The IEF is the neutral facilitator of informal, open, informed and continuing global energy dialogue. Covering all six continents, the IEF is unique in that it comprises not only countries of the IEA and OPEC, but also key players including China, India, Russia and South Africa. The Forum’s biennial Ministerial Meetings are the world’s largest gathering of Energy Ministers. Through the Forum and its associated events, IEF Ministers, their officials, energy industry executives, and other experts engage in a dialogue of increasing importance to global energy security and orderly energy transitions. The IEF and the global energy dialogue are promoted by a permanent Secretariat of international staff based in the Diplomatic Quarter of Riyadh, Saudi Arabia. For more information visit www.ief.org.