Comparative Analysis of Monthly Reports on the Oil Market
Tuesday 14 July 2026


Summary
Outlooks for the global oil market remain distinct in 2026 but converge in 2027. Oil demand projections for 2026 range from a contraction of 1.2 mb/ d to growth of 0.8 mb/d year-on-year, while forecasts for 2027 converge on a recovery of approximately 1.9–2.0 mb/d.
Demand
OPEC: OPEC lowered its 2026 global oil demand growth forecast by 0.2 mb/d from last month's outlook to 0.8 mb/d year-on-year, with demand growth almost entirely concentrated in non-OECD economies. In contrast, the organization revised its 2027 forecast upward by 0.2 mb/d to 1.9 mb/d, driven by projected growth of ~1.6 mb/d in non-OECD countries and 0.3 mb/d in OECD economies.
EIA: The EIA revises its 2026 global oil demand outlook downward to a contraction of 1.2 mb/d, 0.1 mb/d below last month's forecast. The decline is driven by weaker demand in both OECD and non-OECD economies, which are projected to contract by 0.4 mb/d and 0.8 mb/d, respectively. The EIA projects demand growth to recover to 2.0 mb/d in 2027; however, this projection is approximately 0.4 mb/d year-on-year lower than its previous assessment.
IEA: The IEA revises its 2026 global oil demand outlook to a year-on-year contraction of 1.0 mb/d, approximately 0.1 mb/d higher than its previous assessment. For 2027, the agency maintains its projection of a strong recovery, with global oil demand increasing by approximately 2.0 mb/d. This growth is expected to be driven primarily by non-OECD economies, which account for around 1.7 mb/d, while OECD demand contributes a more modest increase of approximately 0.3 mb/d.
Supply
OPEC: OPEC left its outlook for non-DoC liquids supply and DoC NGL growth unchanged from last month's assessment, projecting an increase of approximately 0.8 mb/d in 2026, led by the United States, Canada, Brazil, and Argentina. The organization also maintained its 2027 forecast at 0.7 mb/d year-on-year, bringing total supply to around 64.3 mb/d, with growth primarily driven by Canada, Qatar, Brazil, and Argentina.
EIA: The EIA revises its outlook for non-DoC liquids supply and DoC NGL production upward, now projecting a year-on-year contraction of approximately 0.6 mb/d in 2026, 1.0 mb/d higher than its previous assessment. EIA expects supply growth to rebound to around 4.0 mb/d in 2027; however, this projection is approximately 1.0 mb/d lower than last month's forecast.
IEA: The IEA makes only minor revisions to its global liquids supply outlook, now projecting production to average around 102.6 mb/d in 2026, approximately 0.2 mb/d higher than in its previous assessment. The agency maintains its outlook for non-DoC liquids supply and DoC NGL production at around 67.0 mb/d in 2026, representing year-on-year growth of 0.2 mb/d. For 2027, the IEA projects non-DoC liquids supply and DoC NGL production to increase by approximately 3.0 mb/d year-on-year, 0.3 mb/d below last month's forecast.
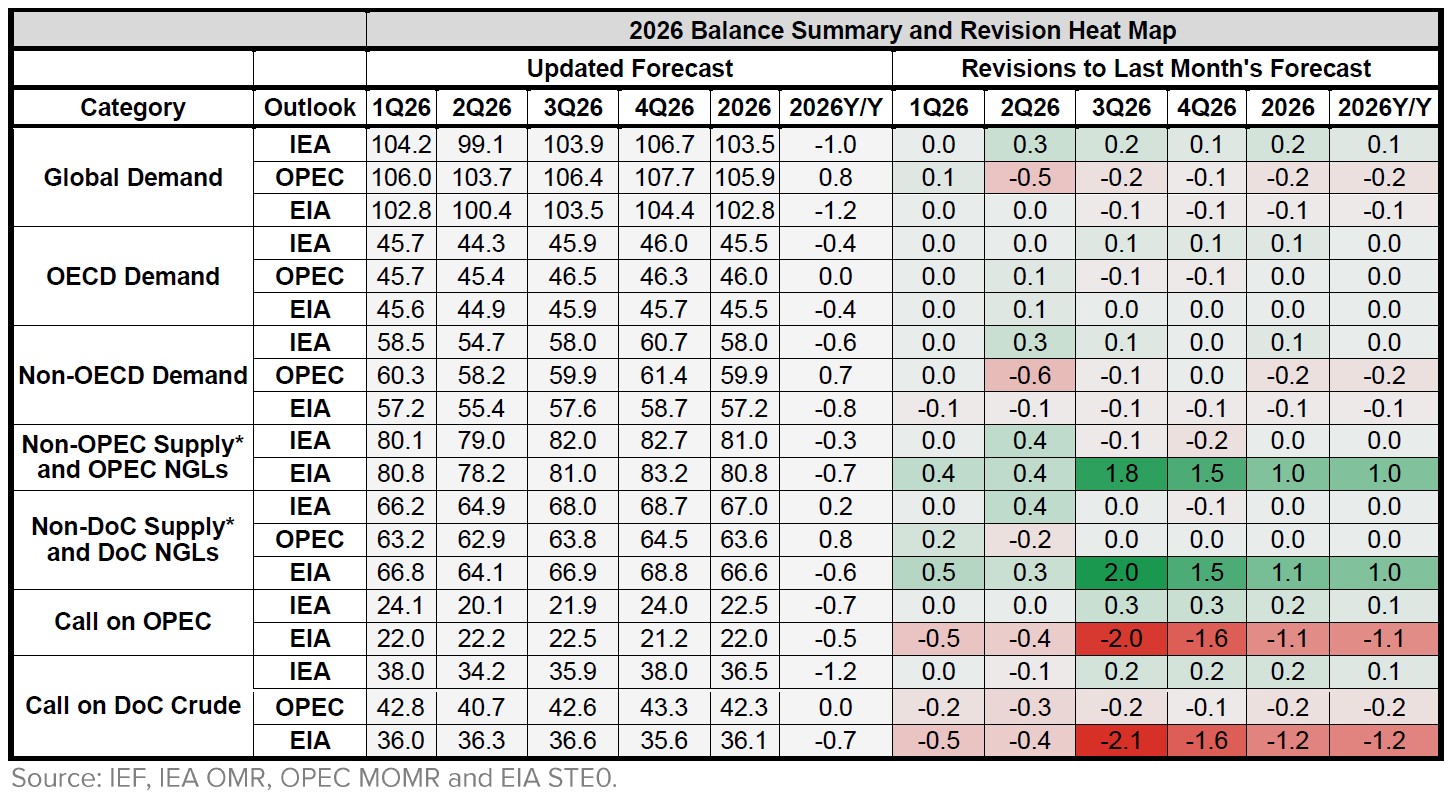
2025-2027 Balance Summary
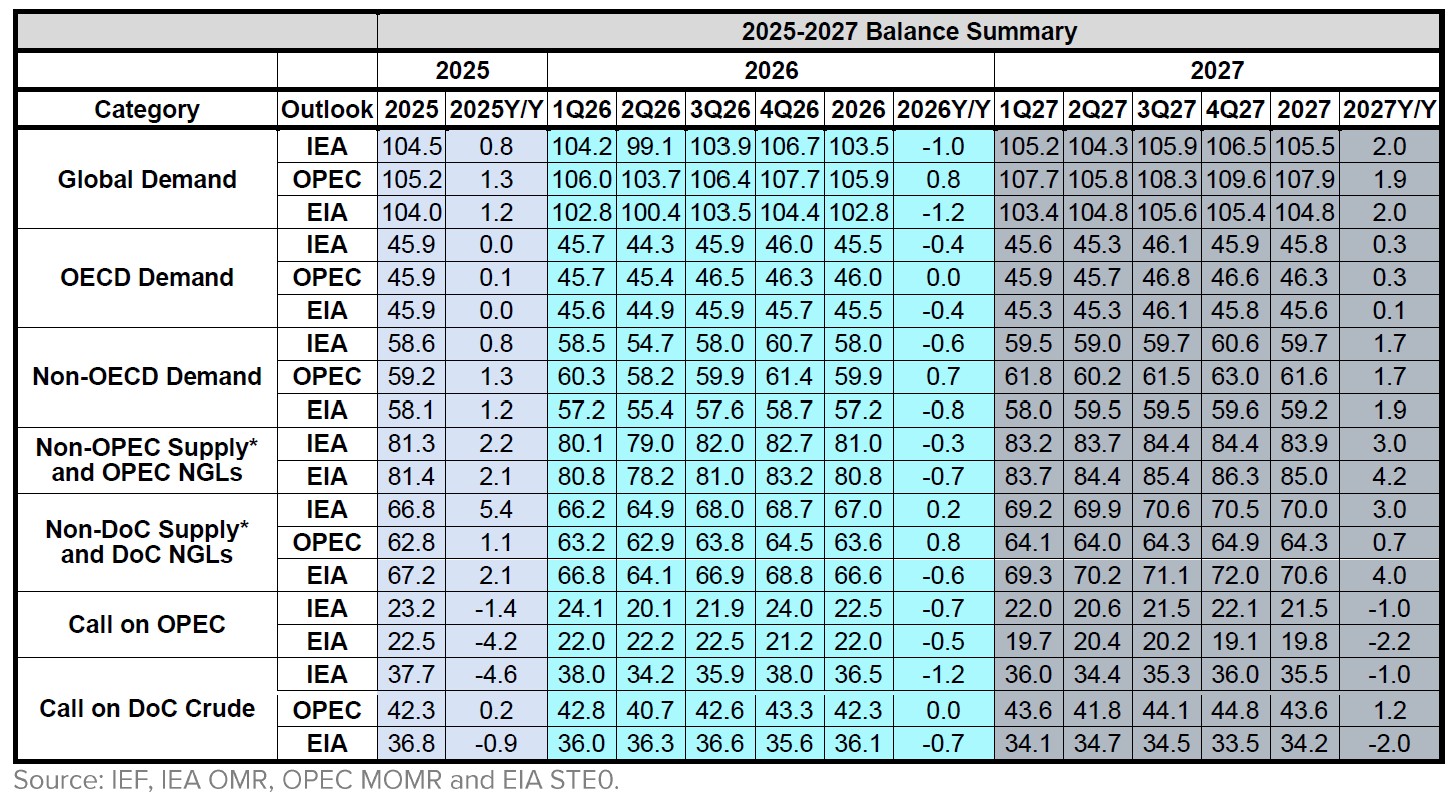
Global oil demand projections remain widely divergent across outlooks in 2026. OPEC forecasts demand at 105.9 mb/d, compared with 103.5 mb/d from the IEA and 102.8 mb/d from the EIA, creating a 3.1 mb/d gap between the highest and lowest estimates. The divergence is also substantial in projected annual growth, which differs by 2.0 mb/d year-on-year across the three outlooks. In 2027, the 3.1 mb/d spread in absolute demand levels persists, but growth forecasts converge substantially, differing by only 0.1 mb/d.
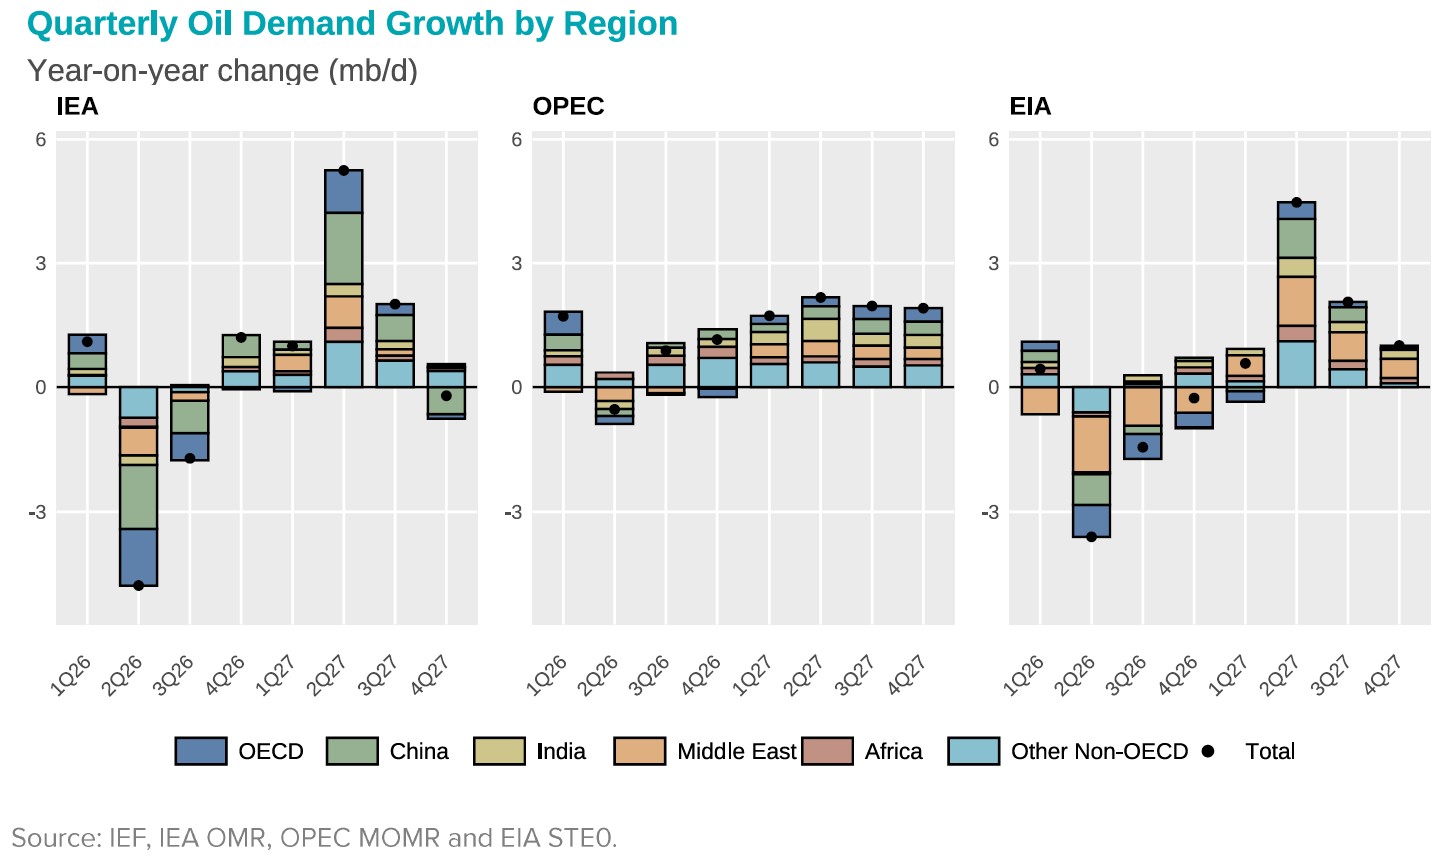
Differences across forecasts are widest in 2Q26 (~4.2 mb/d) and remain substantial in 2Q27 (~3.0 mb /d). This disparity narrows sharply in 3Q27, when projections converge to within 0.1 mb/d of one another, before widening again in 4Q27. Across all three outlooks, quarterly variations are driven primarily by non-OECD demand, particularly China, Middle East and other emerging economies, whereas OECD demand remains comparatively subdued and contributes little to changes in the overall growth profile.
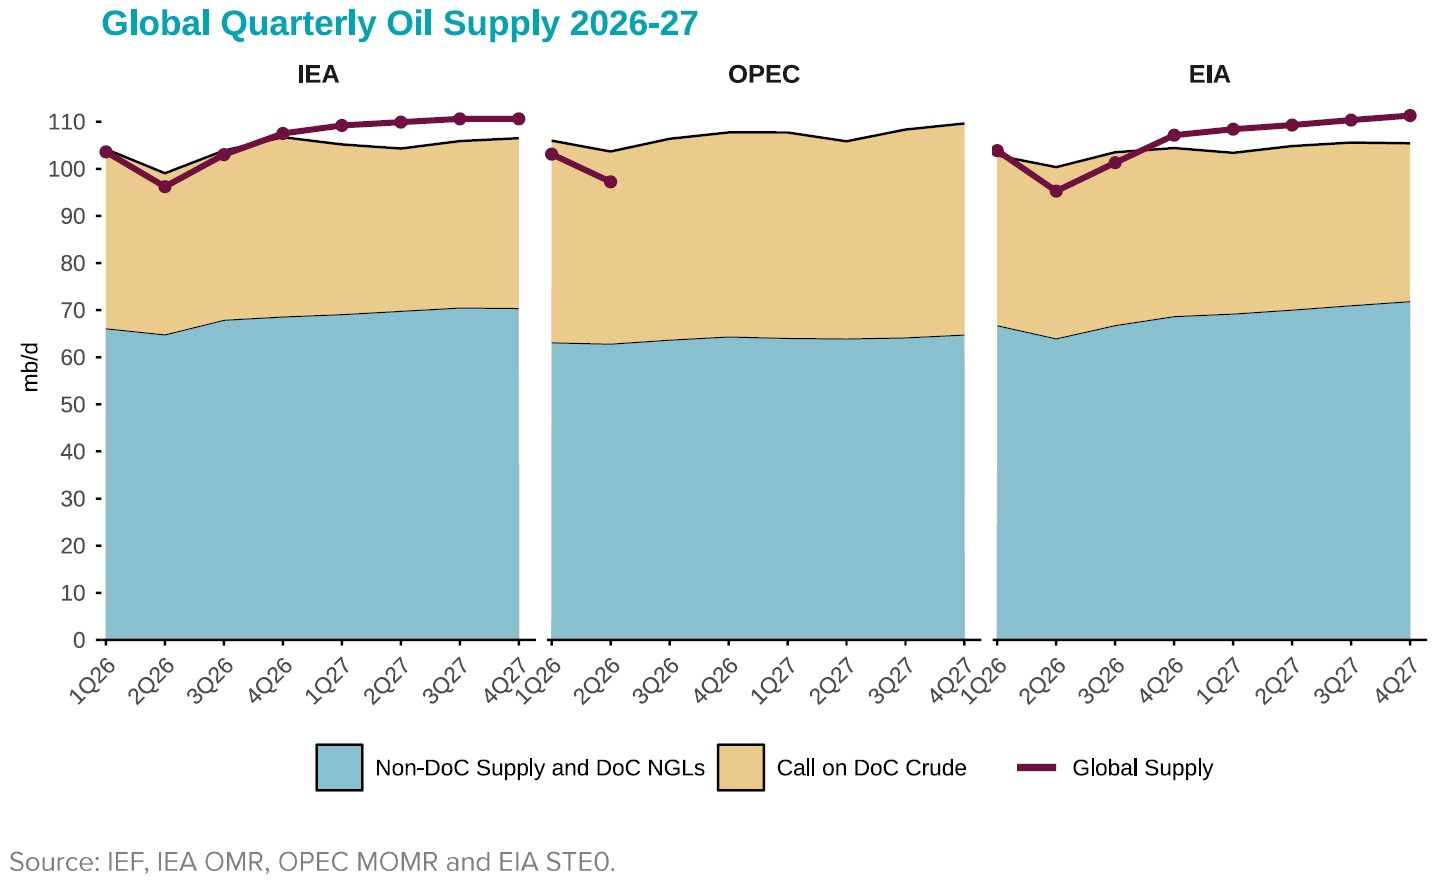
Forecasts for non-DoC liquids supply and DoC NGL production show a persistent divergence across outlooks throughout 2026-2027. OPEC projects lower supply than the EIA and IEA, with the gap widening from around 2-4 mb/d in 2026 to more than 7.0 mb/d by late 2027, while the EIA and IEA remain closely aligned. During 2026, EIA projections range from 64.1 to 68.8 mb/d and IEA estimates from 64.9 to 68.7 mb/d, with differences generally remaining below 1.0 mb/d. This close agreement persists into 2027, when the EIA projects supply of 69.2-72.0 mb/d and the IEA 69.9-70.6 mb/d. In contrast, OPEC maintains substantially lower projections of 64.0–64.9 mb/d throughout the year.
2026 Outlook Comparison
In 2026, OPEC forecasted growth of 0.8 mb/d while the IEA and EIA project declines of 1.0 and 1.2 mb/d, respectively, a spread of 2.0 mb/d. This divergence is concentrated almost entirely in non-OECD demand, where OPEC expects growth (+0.7 mb /d) against contractions projected by the IEA (-0.6 mb/d) and EIA (-0.8 mb/d).
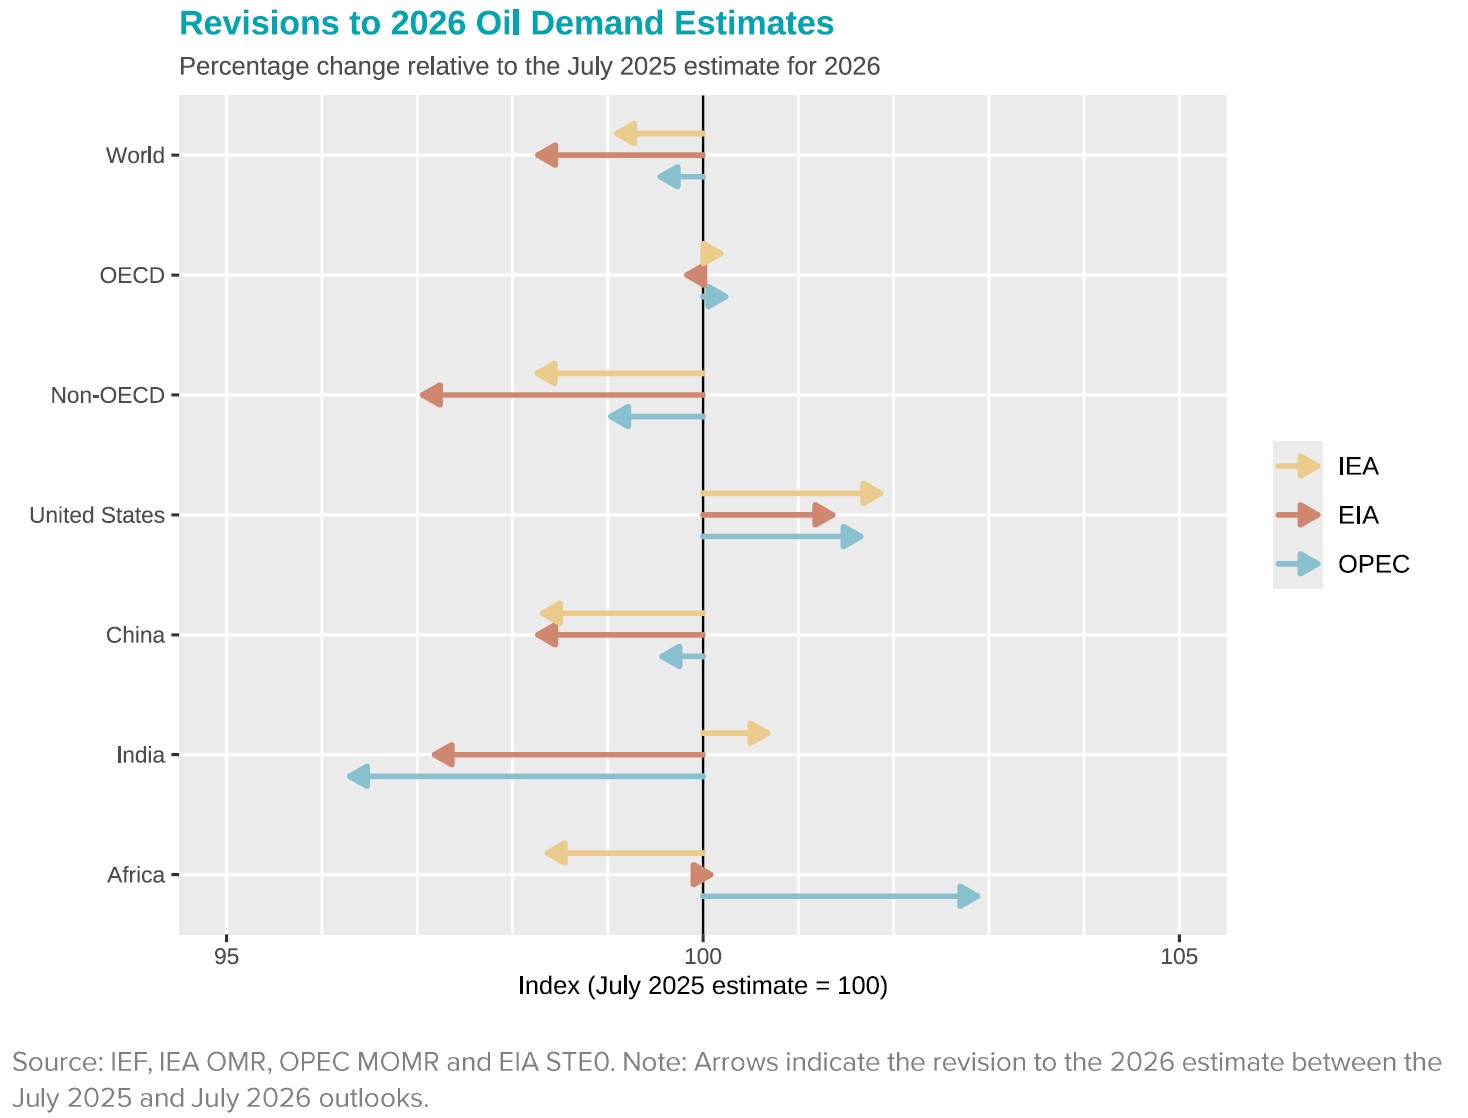
Recent revisions to 2026 oil demand estimates are driven primarily by adjustments in non-OECD economies, where the EIA (~ -3%) and IEA (~ -1.7%) make substantially larger downward adjustments than OPEC (~ -1.0%), while OECD revisions remain small and mixed in direction across all three outlooks. More notable differences emerge at the regional level. The United States is revised upward across all three outlooks. Africa shows the sharpest split: OPEC revises demand up sharply (roughly +2.9%), while the IEA revises it down (~ -1.6%) and the EIA leaves its estimate nearly flat. China is revised downward by both the IEA and EIA by a similar margin (~ -1.69 % to -1.72%), while OPEC's China estimate is only marginally lowered (~ -0.4%). India shows a wide divergence: the IEA holds close to baseline (a slight upward revision), while OPEC lowers demand the most of any outlook-region pair (~ -3.7%), with the EIA also cutting sharply ~ -2.8%).
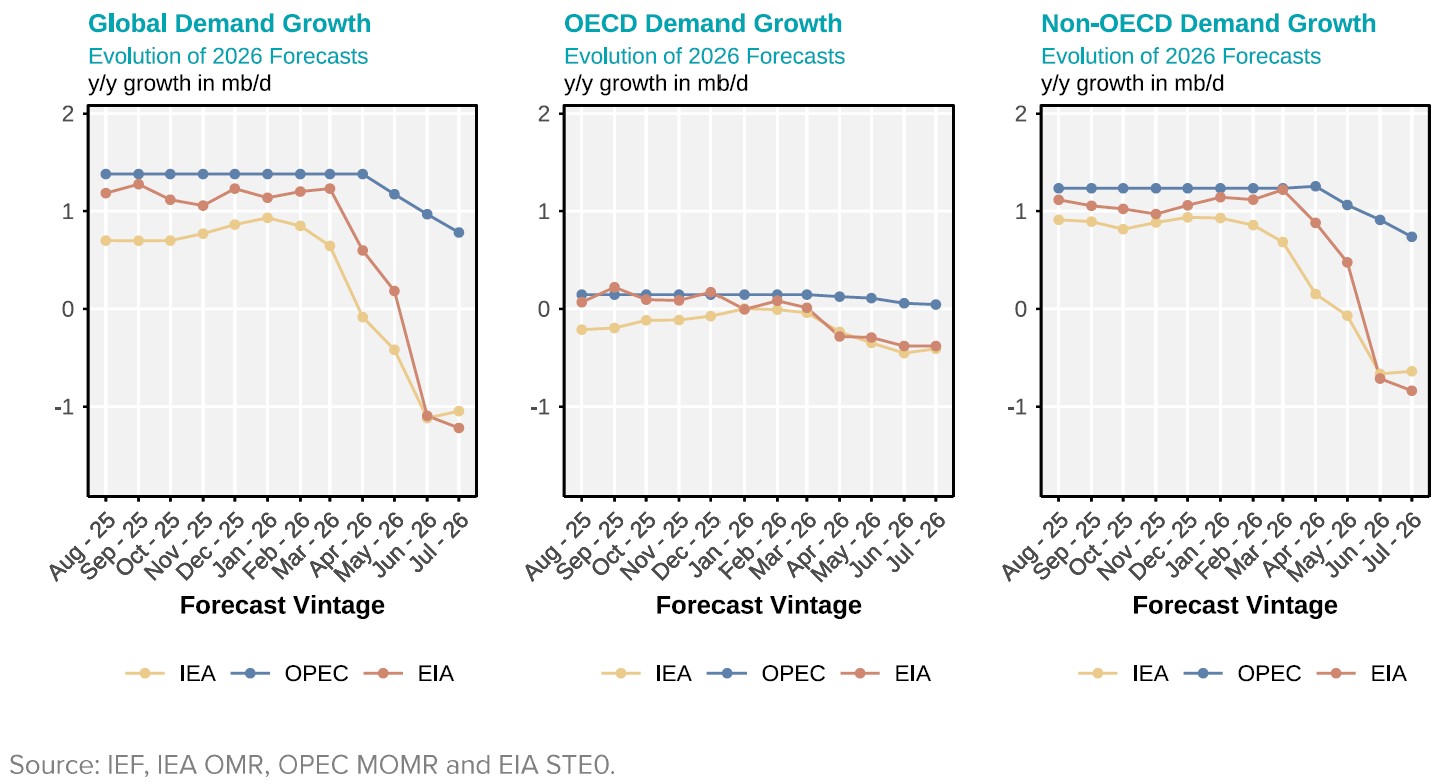
Evolution of 2026 Annual Demand Growth Forecasts
In January 2026, OPEC projects 1.4 mb/d growth, while the IEA and EIA estimate 0.9 and 1.1 mb/d respectively, a 0.5 mb/d spread. This gap widens sharply by June, where the IEA and EIA both forecast negative growth (-1.1 and -1.2 mb/d), whereas OPEC maintains growth near 1.0 mb/d, pushing the spread to roughly 2.0 mb/d by July. OECD demand stays roughly flat across outlooks throughout, while non-OECD demand accounts for nearly all the disagreement, with OPEC projecting sustained growth of 0.7-1.3 mb/d against the IEA's decline to -0.7 mb/d by mid-year.
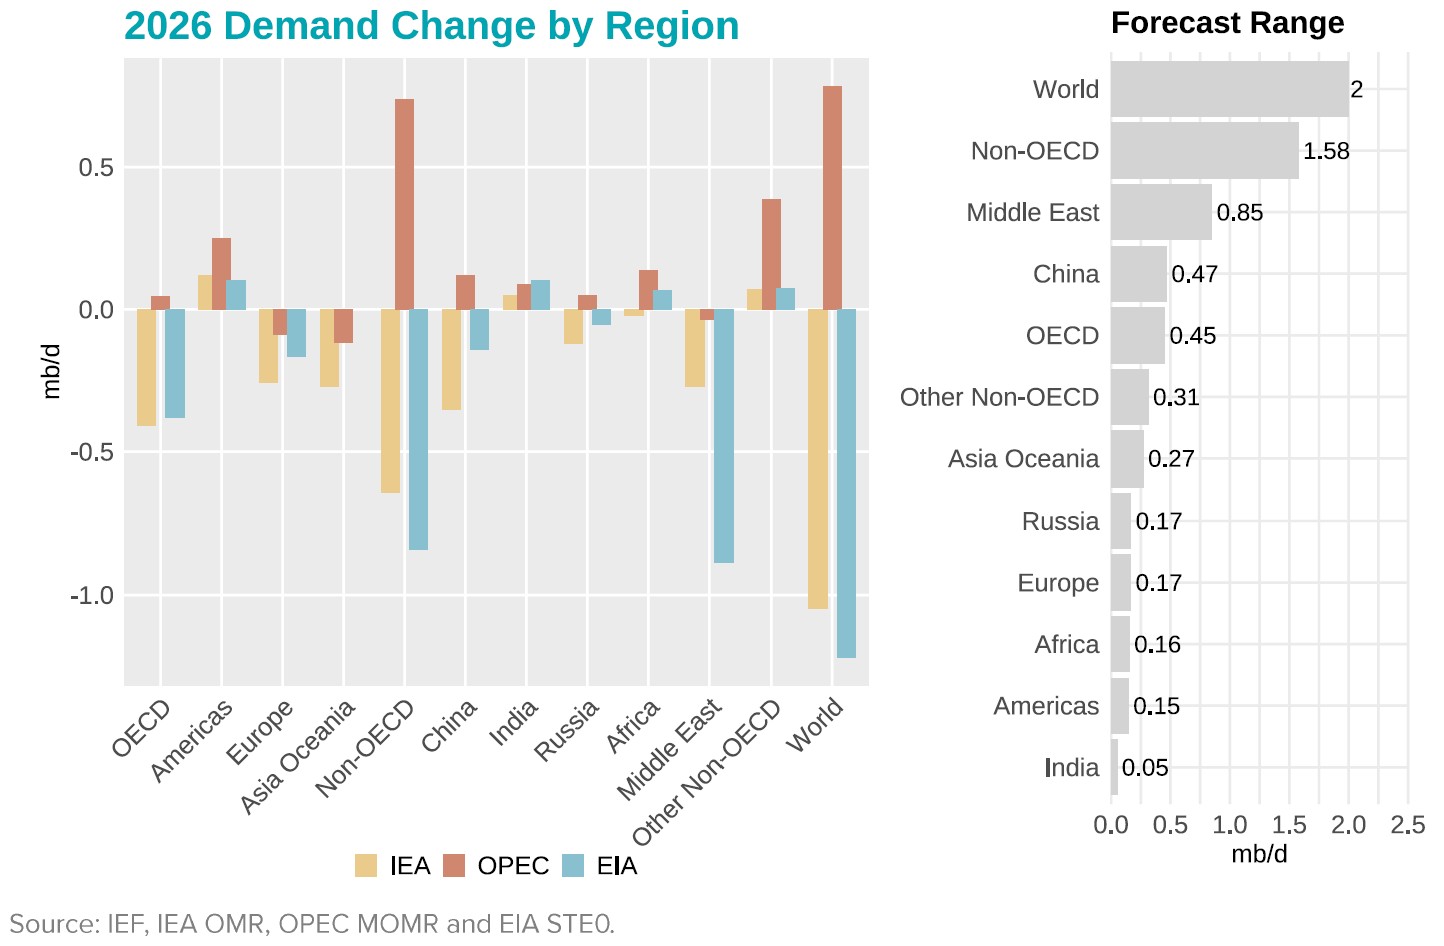
At the regional level, OECD contracts in both the IEA and EIA outlooks (~ -0.4 mb/d), while OPEC projects broadly flat demand. Non-OECD economies follow a similar pattern, with the IEA and EIA both forecasting declines of around 0.6-0.8 mb/d, whereas OPEC continues to project growth of roughly 0.7 mb/d. Within the non-OECD region, both the IEA and EIA forecast declining demand in China (-0.35 and -0.14 mb/d) against a marginal increase in OPEC's outlook (+0.12 mb/d), while India and Africa record modest demand growth across all three outlooks, with the EIA projecting the largest increase for India at 0.1 mb/d.
2027 Outlook Comparison
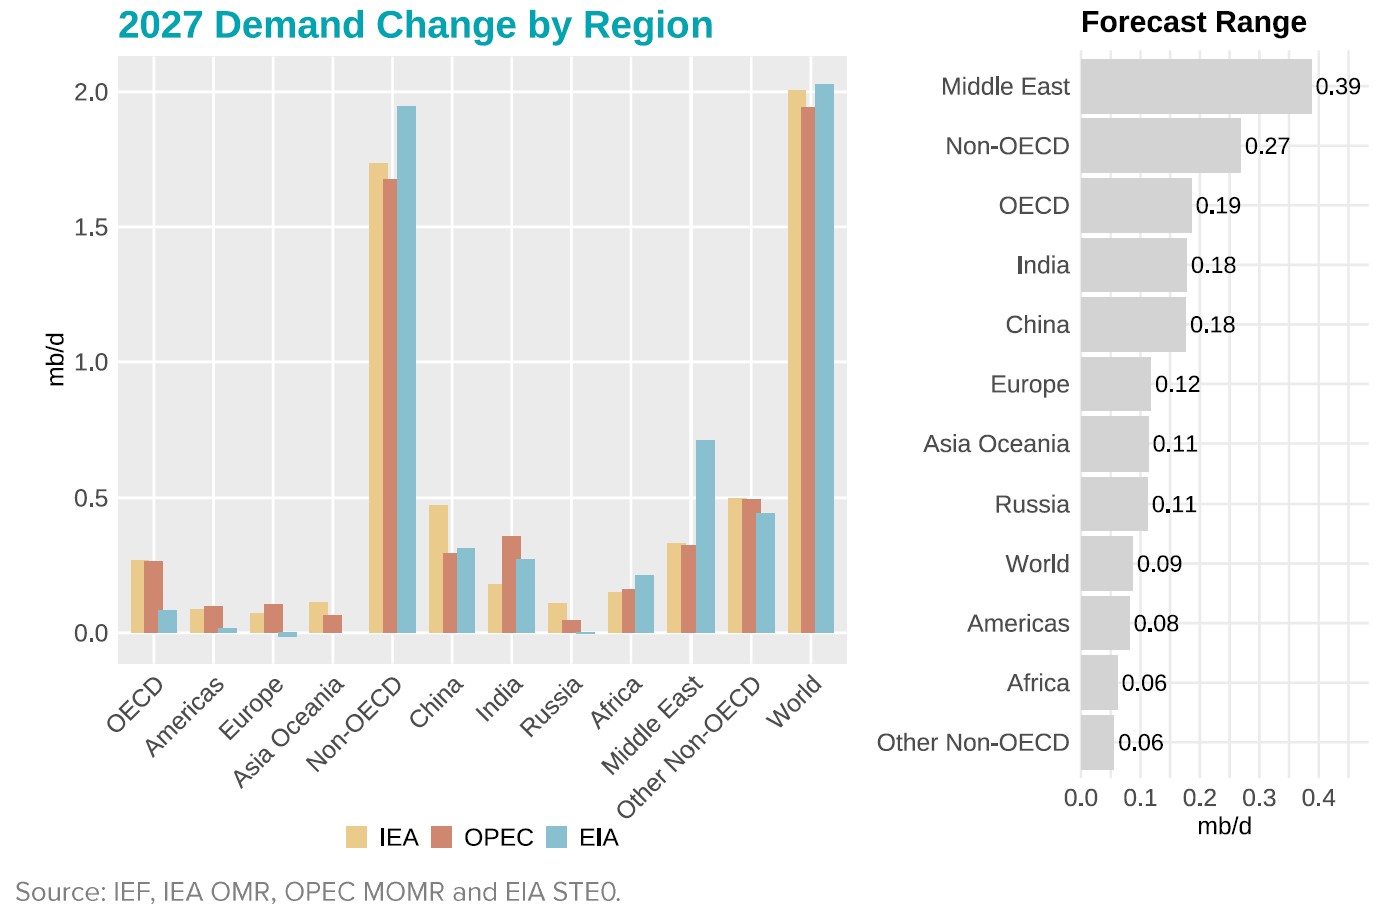
Unlike in 2026, outlooks converge closely on global oil demand growth in 2027, with the IEA, OPEC, and the EIA all projecting year-on-year growth of 1.9-2.0 mb/d. This consensus extends to both OECD and non-OECD demand, where growth estimates differ by no more than 0.2 mb/d across the three outlooks. Monthly revisions reveal that the EIA lowers its 2027 demand forecast by a consistent 0.5 mb/d across all quarters, while the IEA and OPEC make only limited adjustments to their projections.
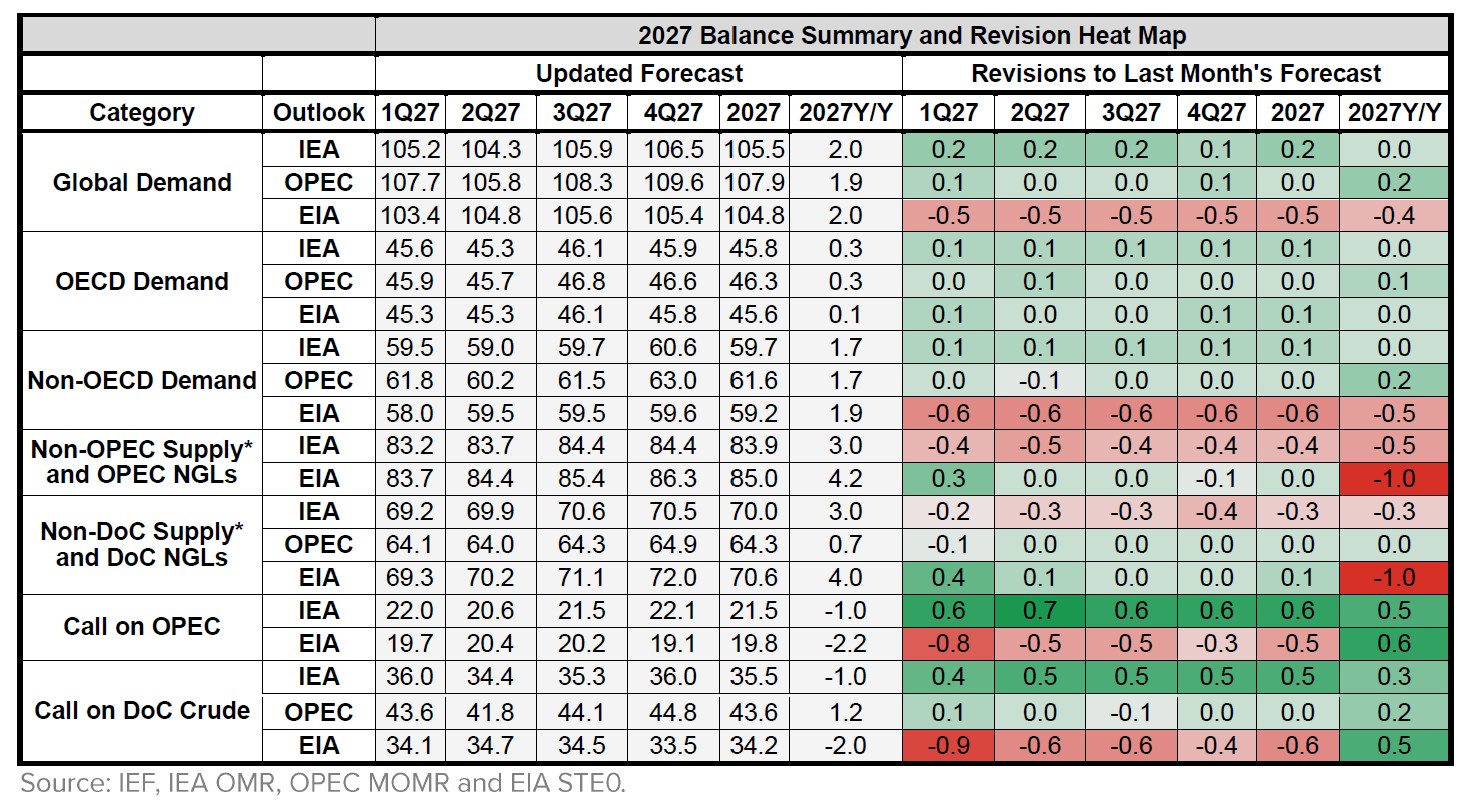
Regional demand projections indicate that non-OECD economies account for over 90% of global demand growth across all three outlooks, while OECD economies contribute only marginally (0.1-0.27 mb/d). Within the non-OECD group, China remains the largest source of demand growth, contributing 0.3-0.5 mb/d, followed by India (0.20-0.36 mb/d) and Africa (0.15-0.21 mb/d).