Comparative Analysis of Monthly Reports on the Oil Market
Thursday 13 August 2026


Summary
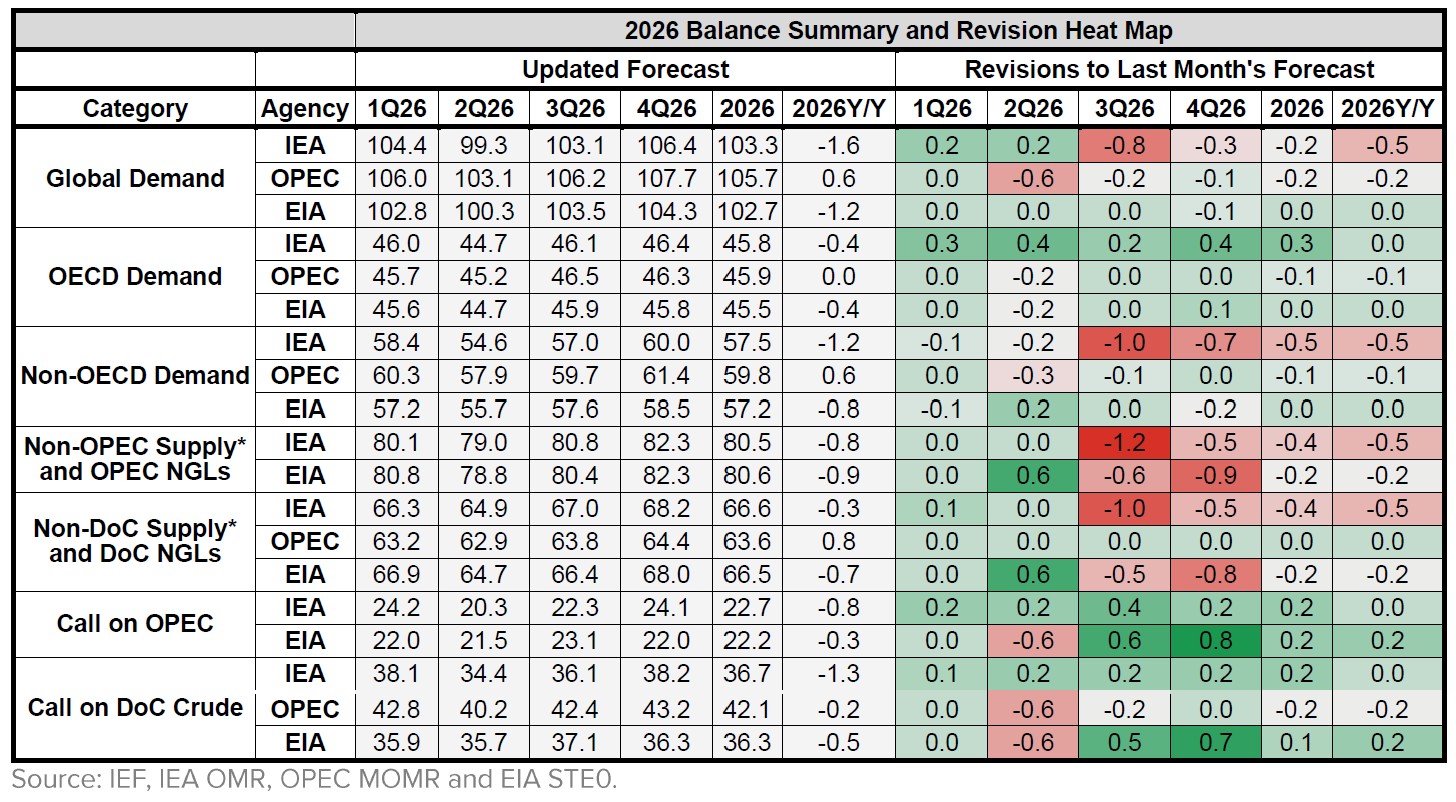
Uncertainty over the near-term global oil demand and supply outlook remains elevated, with major forecasters offering markedly different assessments of the market trajectory in 2026. Global oil demand expectations span from a contraction of 1.6 mb/d to growth of 0.6 mb/d year-on-year, reflecting substantial differences in underlying assumptions. By 2027, however, demand growth expectations converge considerably, clustering within a narrower range of 2.2-2.4 mb/d.
Demand
OPEC: OPEC projects global oil demand growth of 0.6 mb/d year-on-year in 2026, with growth entirely concentrated in non-OECD economies, while OECD demand remains broadly unchanged. In 2027, OPEC expects global oil demand growth to accelerate to 2.2 mb/d, driven predominantly by 1.8 mb/d of growth in non-OECD economies, alongside a more modest 0.3 mb/d increase across OECD economies.
EIA: The EIA maintains its 2026 global oil demand outlook at a contraction of 1.2 mb/d, unchanged from its previous assessment. Demand declines across both OECD and non-OECD economies, by 0.4 mb/d and 0.8 mb/d, respectively. In 2027, the EIA expects global oil demand growth to rebound to 2.2 mb/d, an upward revision of 0.2 mb/d from last month’s outlook.
IEA: The IEA revises its 2026 global oil demand outlook downward, with demand contracting by 1.6 mb/d year-on-year, more than 0.5 mb/d below last month’s assessment. The contraction is concentrated in non-OECD economies, where demand declines by 1.2 mb/d, compa red with a 0.4 mb/d decline across OECD economies. In 2027, the IEA expects global oil demand growth to rebound to 2.4 mb/d year-onyear, an upward revision of 0.4 mb/d from its previous estimate.
Supply
OPEC: OPEC projects non-DoC liquids supply and DoC NGL production to grow by 0.8 mb/d year-onyear in 2026, reaching 63.6 mb/d, with growth led by the United States, Canada, Brazil, and Argentina. In 2027, OPEC projects growth to moderate slightly to 0.7 mb/d, bringing combined production to around 64.3 mb/d, with Canada, Qatar, Brazil, and Argentina as the primary drivers of growth.
EIA: The EIA revises its 2026 outlook for non-DoC liquids supply and DoC NGL production downward by 0.2 mb/d, to 66.5 mb/d, representing a year-on-year contraction of 0.7 mb/d. In 2027, the EIA expects non-DoC liquids supply and DoC NGL production to rebound by around 4.3 mb/d, reaching 70.8 mb/d, 0.3 mb/d above last month’s forecast.
IEA: The IEA revises its 2026 outlook for non-DoC liquids supply and DoC NGL production downward, with combined production contracting by 0.3 mb/d year-on-year to 66.6 mb/d, around 0.5 mb/d below last month’s estimate. In 2027, the IEA expects non-DoC liquids supply and DoC NGL production to rebound by around 3.5 mb/d, reaching 70.1 mb/d, 0.5 mb/d above its previous assessment.
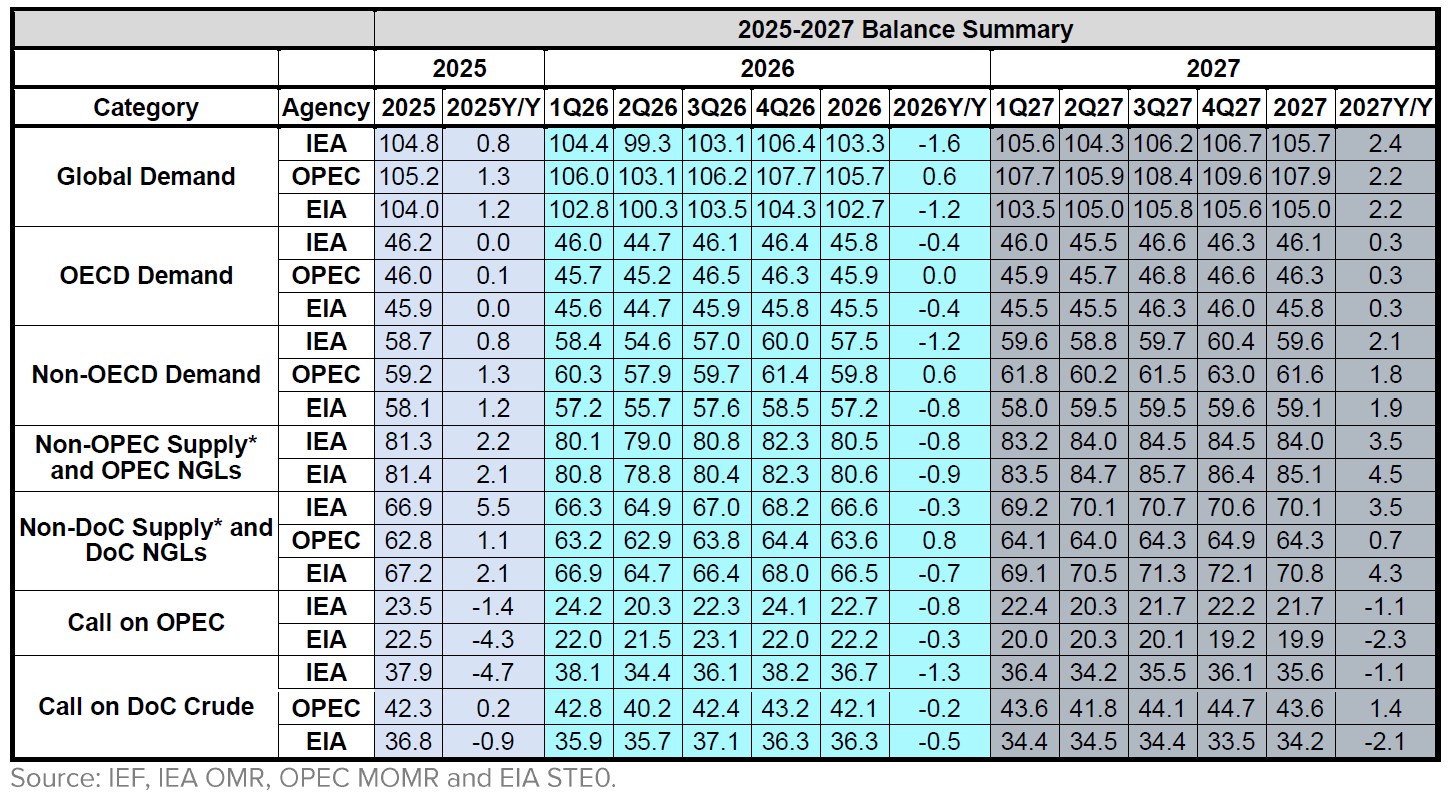
2025-2027 Balance Summary
Uncertainty over the near-term trajectory of global oil demand remains substantial. OPEC projects demand to increase by 0.6 mb/d year-on-year to 105.7 mb/d, while the EIA and IEA expect contractions of 1.2 mb/d and 1.6 mb/d, placing demand at 102.7 mb/d and 103.3 mb/d, respectively. This leaves a 2.2 mb/d range in annual growth forecasts and a 3.0 mb/d spread in absolute demand levels. By 2027, however, the divergence becomes concentrated in demand levels rather than growth: estimates remain separated by 2.9 mb/d, ranging from 105.0 to 107.9 mb/d, while growth forecasts converge within a relatively narrow 2.2–2.4 mb/d range.
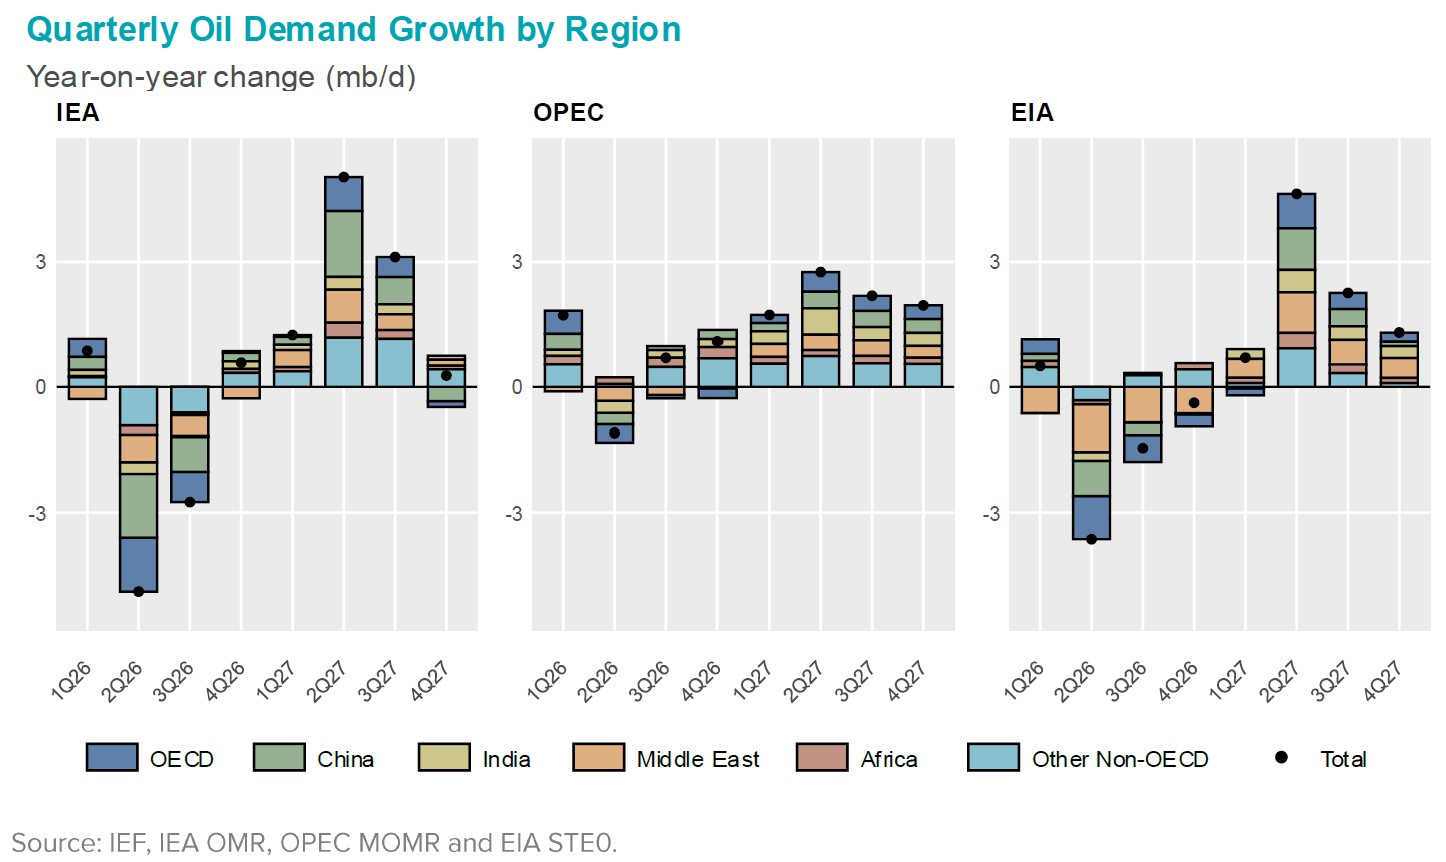
The quarterly profiles reveal an uneven pattern of divergence across the three outlooks. The gap is largest in 2Q26, at around 3.8 mb/d, and remains substantial in 3Q26 at around 3.4 mb/d, before narrowing towards the end of the year. Differences are generally smaller in 2027, although a notable 2.3 mb/d spread re-emerges in 2Q27. Much of this variation reflects contrasting assessments of non-OECD demand, particularly in China, the Middle East and other emerging economies. Differences in OECD demand projections contribute comparatively less to the divergence across the three outlooks, except in 2Q26 and 2Q27, when OECD demand movements become more significant.
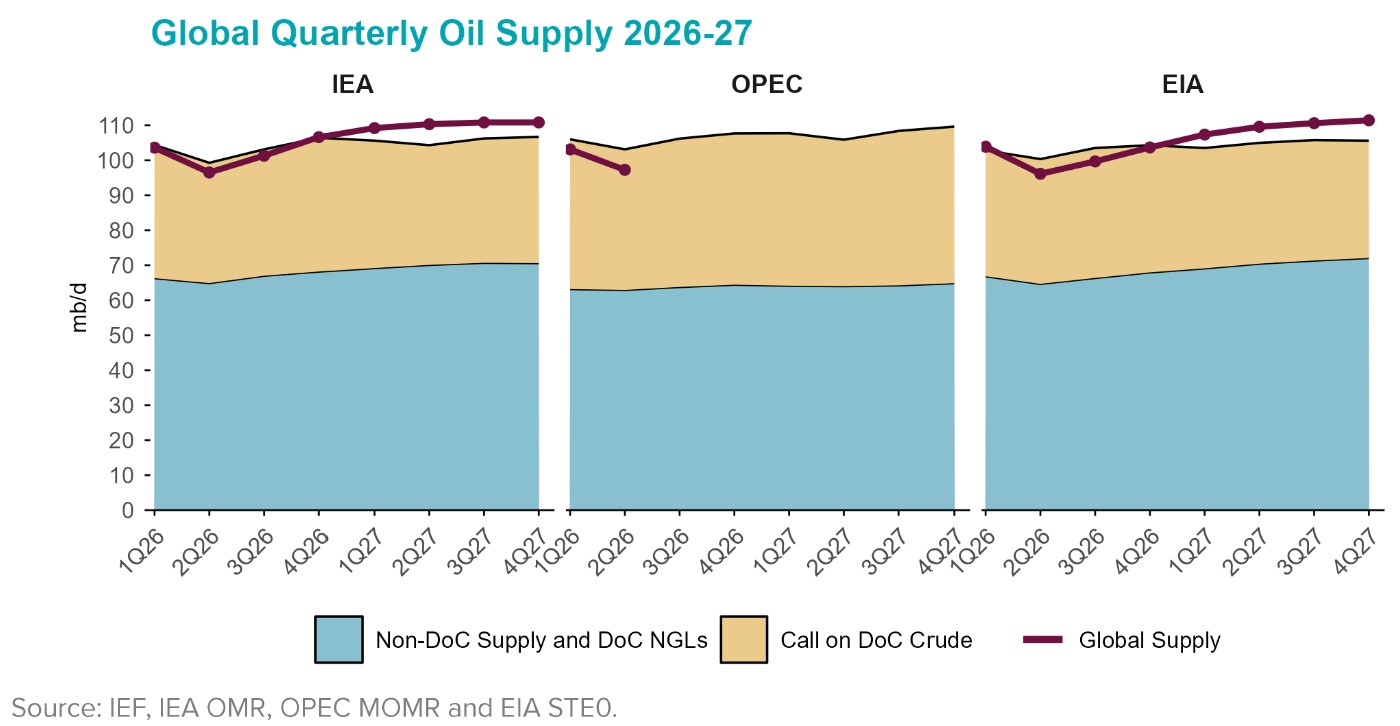
A clear divide remains in projections for non-DoC liquids supply and DoC NGL production, with OPEC estimates below those of the EIA and IEA throughout 2026–2027. In 2026, the difference remains relatively contained: OPEC projects quarterly supply of 62.9-64.4 mb/d, compared with 64.9-68.2 mb/d for the IEA and 64.7–68.0 mb/d for the EIA. The gap widens substantially in 2027, reflecting stronger supply growth expected by the EIA and IEA relative to OPEC. By 4Q27, OPEC projects 64.9 mb/d, compared with 70.6 mb/d for the IEA and 72.1 mb/d for the EIA, widening the spread to as much as 7.2 mb/d. In contrast, EIA and IEA projections remain relatively close through 2026 and early 2027, before diverging more noticeably towards the end of the forecast period.
2026 Outlook Comparison
Contrasting assessments of non-OECD consumption underpin much of the difference in the 2026 global oil demand outlook. OPEC expects non-OECD demand to increase by 0.6 mb/d, whereas the EIA and IEA project decline by 0.8 mb/d and 1.2 mb/d, respectively. These differences translate into sharply different global trajectories, ranging from 0.6 mb/d growth under OPEC to a 1.6 mb/d contraction under the IEA, a 2.2 mb/d spread. By comparison, OECD expectations are more closely aligned, ranging from no growth under OPEC to declines of 0.4 mb/d under both the EIA and IEA.
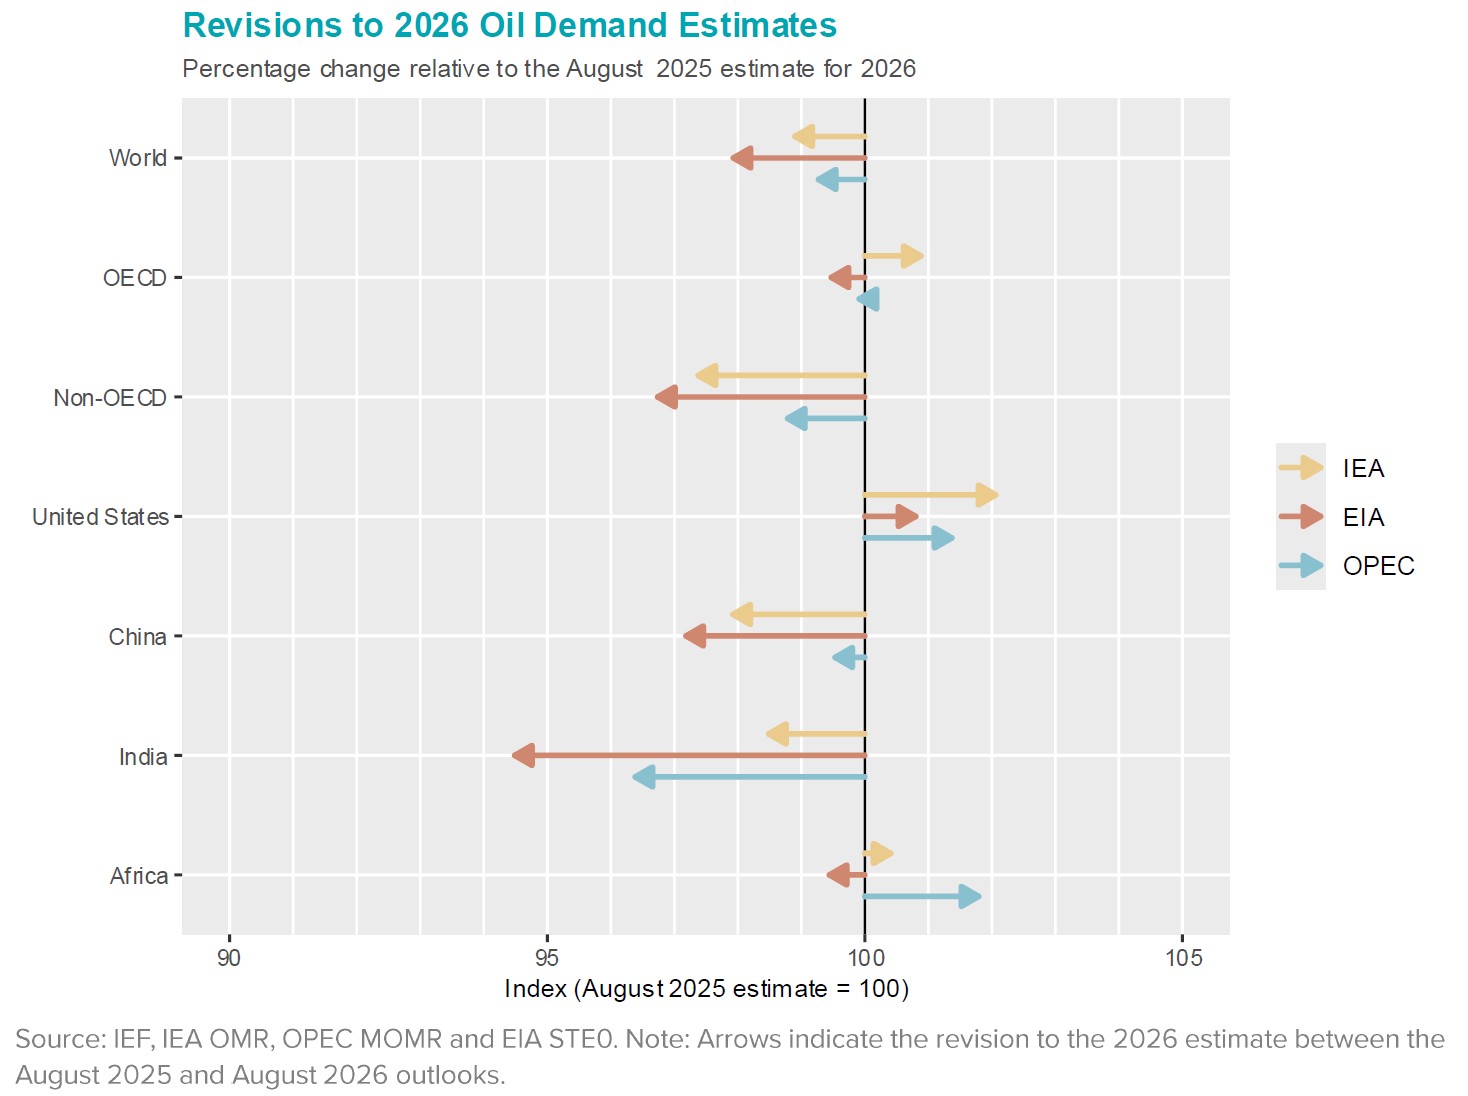
The latest revisions to 2026 oil demand remain concentrated in non-OECD economies, although the scale of adjustment varies considerably across the three outlooks. The EIA lowers its estimate by 3.3% and the IEA by 2.6%, compared with a more moderate 1.2% reduction by OPEC. Changes to OECD demand are much smaller and move in different directions, ranging from a 0.5% downward revision by the EIA to a 0.9% increase by the IEA. At the country and regional level, the picture becomes more differentiated. US demand is revised upward by all three outlooks, most strongly by the IEA (+2.1%), while China faces broad-based downward revisions, ranging from just -0.5% under OPEC to -2.8% under the EIA. India sees the deepest cuts, particularly from the EIA (-5.5%) and OPEC (-3.6%), compared with -1.5% by the IEA. Revisions for Africa move in both directions, with OPEC raising its estimate by 1.8% and the IEA by 0.4%, against a 0.6% reduction by the EIA.
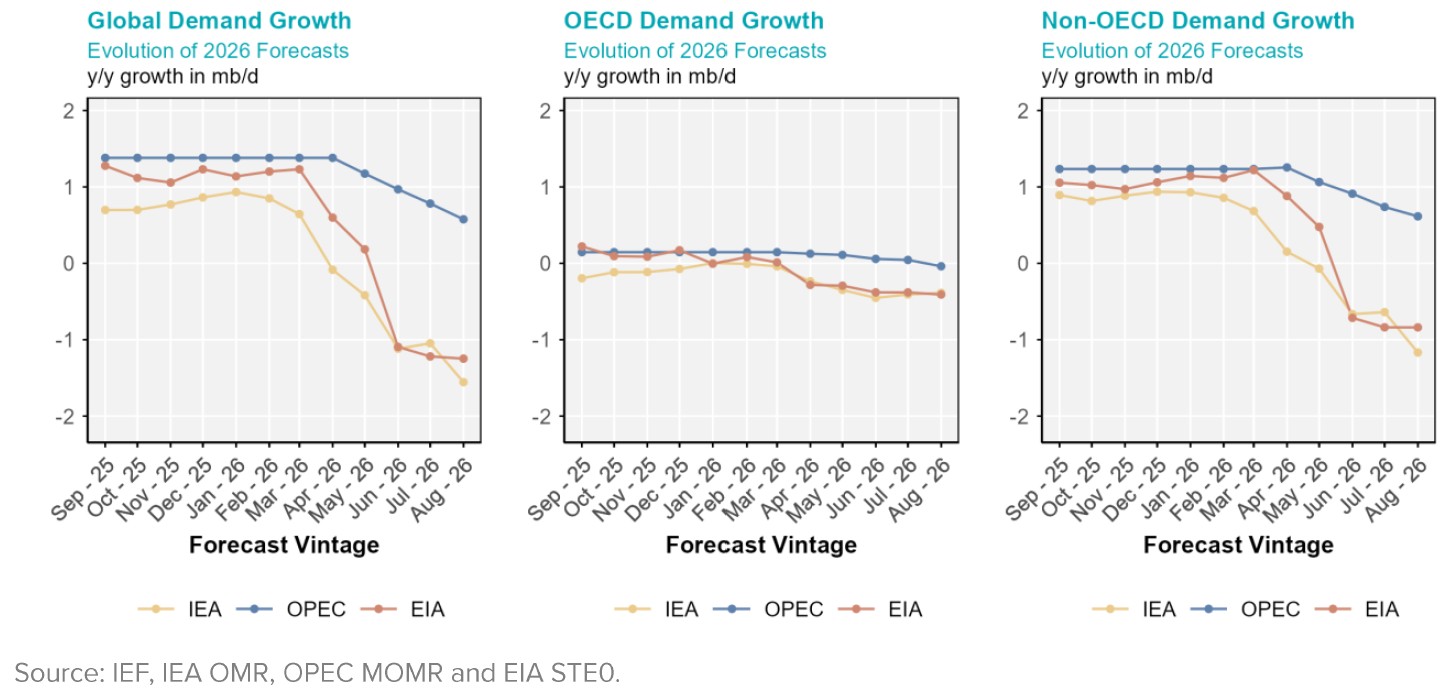
Evolution of 2026 Annual Demand Growth Forecasts
The evolution of 2026 demand forecasts show a progressive separation in expectations over the course of the year. In January, OPEC projects global demand growth of around 1.4 mb/d, compared with 0.9 mb/d from the IEA and 1.1 mb/d from the EIA. By June, the IEA and EIA have shifted to contractions of around 1.1 mb/d, while OPEC continues to expect growth of approximately 1.0 mb/d. The gap expands further by August, with OPEC projecting 0.6 mb/d of growth, against declines of 1.6 mb/d from the IEA and 1.2 mb/d from the EIA, resulting in a spread of more than 2.2 mb/d.
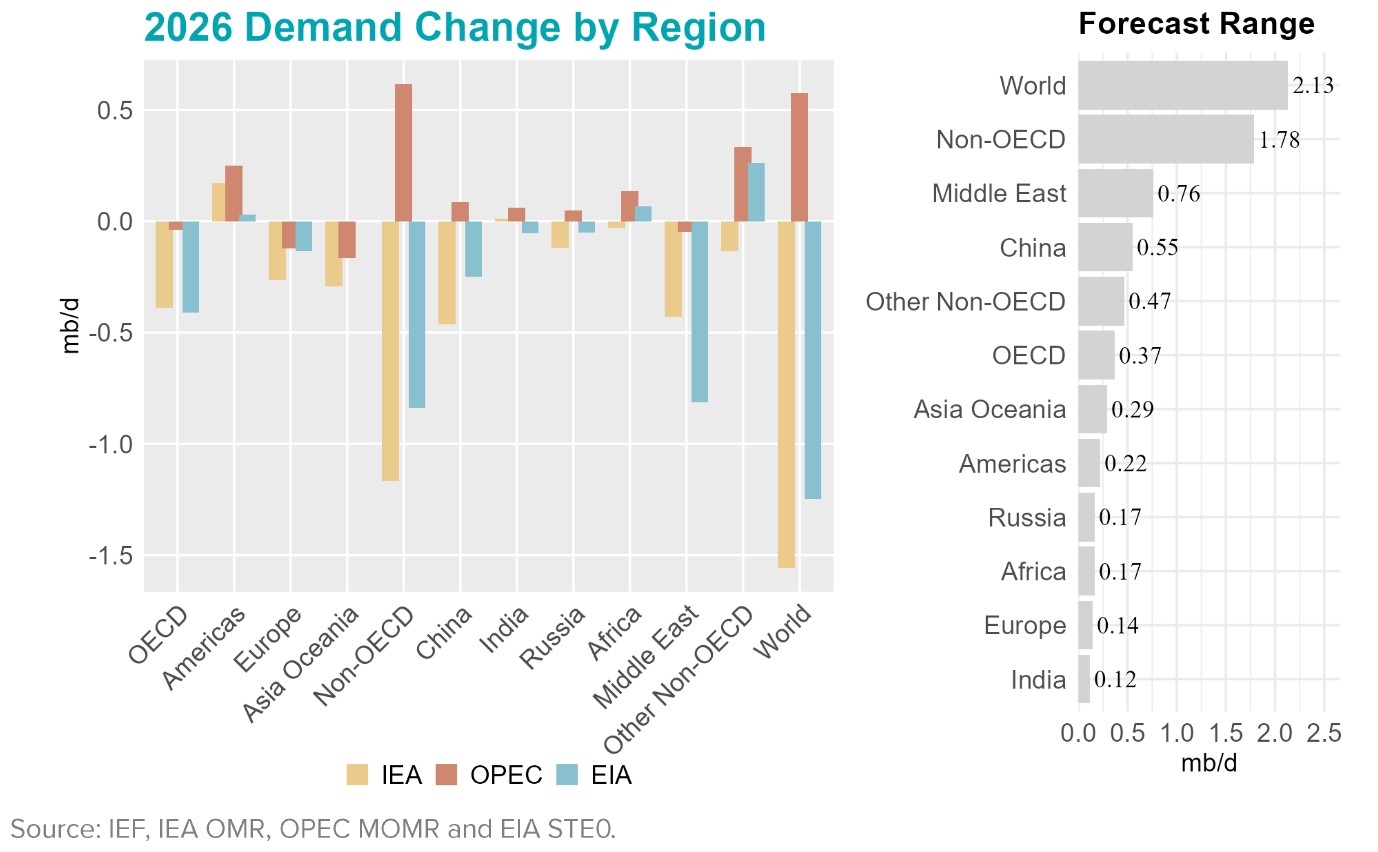
At the regional level, OECD demands contracts in both the IEA and EIA outlooks by around 0.4 mb/d, while OPEC projects broadly flat demand, largely unchanged from last month's estimate. The contrast is considerably greater across non-OECD economies, where the IEA and EIA project contractions of 1.2 mb/d and 0.8 mb/d, respectively, against 0.6 mb/d of growth under OPEC. Within non-OECD markets, China declines by 460 kb/d under the IEA and 250 kb/d under the EIA, while OPEC expects a modest ~100 kb/d increase. Assessments also differ for India and Africa: OPEC projects growth in both, while the IEA sees India broadly flat and Africa slightly lower, and the EIA expects a small contraction in India but modest growth in Africa.
2027 Outlook Comparison
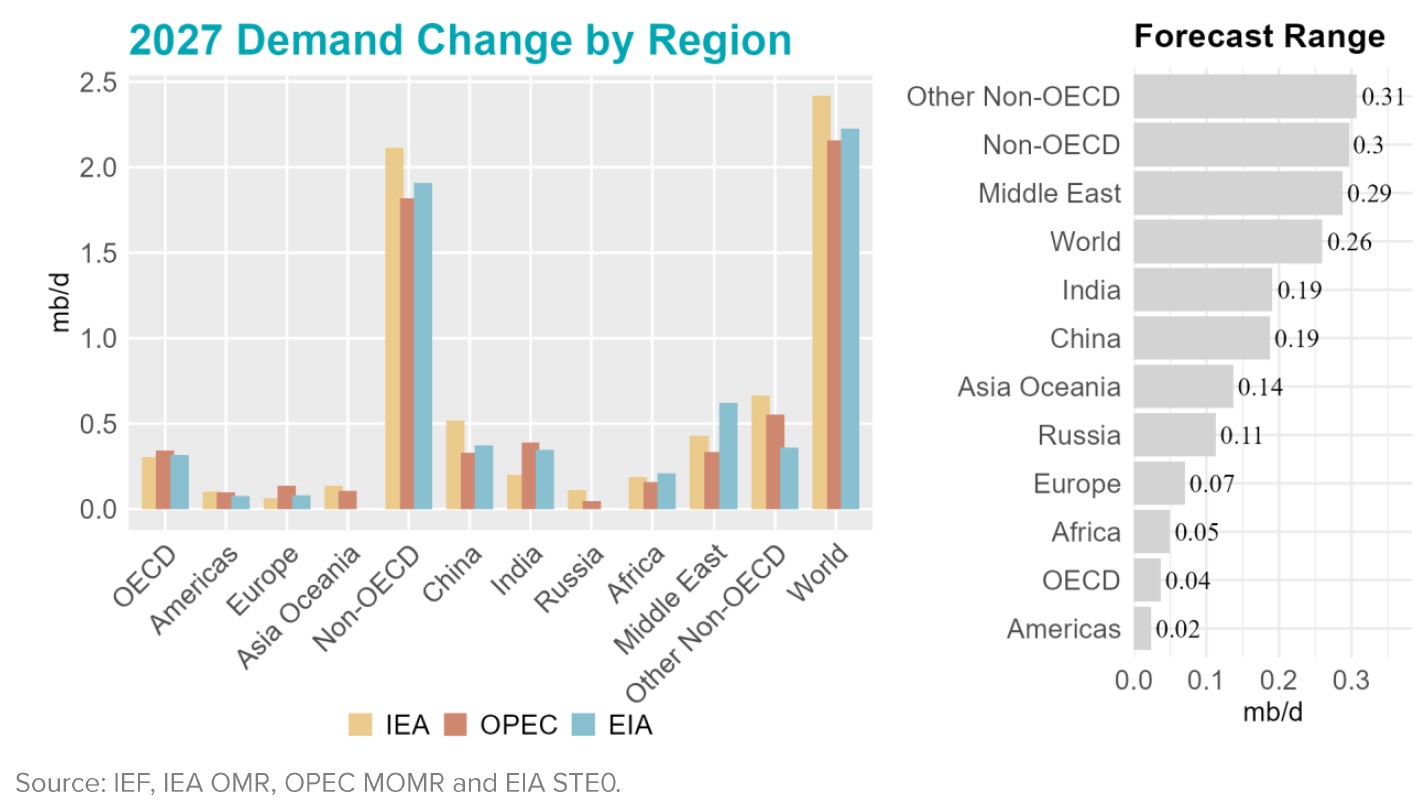
The 2027 outlook shows much greater alignment in the expected pace of global oil demand growth than in 2026, with OPEC and the EIA both projecting an increase of 2.2 mb/d year-on-year and the IEA slightly higher at 2.4 mb/d. OECD expectations are fully aligned at around 0.3 mb/d of growth, while non-OECD projections remain relatively close, ranging from 1.8 mb/d under OPEC to 2.1 mb/d under the IEA. Recent revisions, however, have moved predominantly upward. The IEA raises its annual global demand estimate by 0.2 mb/d, with upward adjustments in most quarters, while the EIA also adds 0.2 mb/d to its 2027 forecast. OPEC leaves the overall demand level unchanged, although its year-on-year growth estimate increases by 0.2 mb/d.
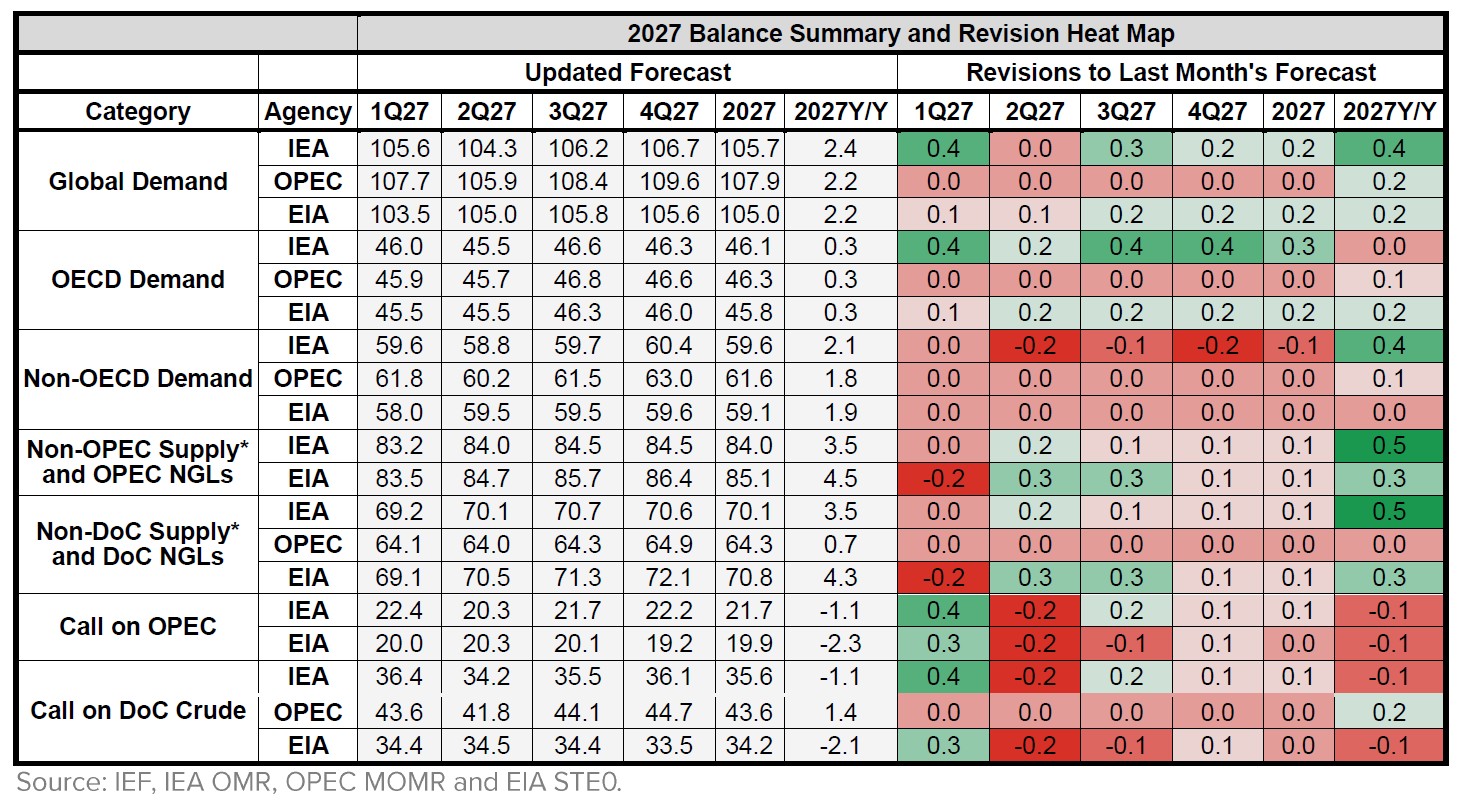
Non-OECD economies remain the principal source of global oil demand growth in 2027, contributing 1.8-2.1 mb/d across the three outlooks, compared with only around 0.3 mb/d from OECD economies. Within the non-OECD group, the sources of growth are more broadly distributed. China contributes 330-520 kb/d, while India adds 200-390 kb/d and Africa 160-210 kb/d. The Middle East also emerges as a major contributor, with projected growth ranging from 340 kb/d under OPEC to 620 kb/d under the EIA, while other non-OECD economies collectively add a further 360-670 kb/d.