")

Comparative Analysis of Monthly Reports on the Oil Market
1. International Policy and Market Context
Energy Markets Rise on Potential COVID-19 Vaccine
- As COVID-19 cases continue to climb in Europe and North America, vaccine developers announced their vaccine was found to be more than 90 percent effective in preventing COVID-19 according to first interim analysis of its phase three study. Oil prices moved higher as WTI climbed 8.5 percent and Brent was up 7.5 percent marking the largest single-session rally on a percentage basis since May and June, respectively.
President-Elect Joe Biden Offers New Energy Vision
- The election of Joe Biden as the 46th President of the United States on 3 November 2020 will have several implications for US energy policy. Beyond rejoining the Paris Agreement and a pathway to net-zero emissions by 2050, the $2 trillion spending goal set for energy transition that is focused on infrastructure may receive bipartisan cooperation. New policies and legislative initiatives will also affect how fast US oil and gas production and job opportunities will recover from COVID-19 impacts.
IEA and OPEC Bearish on Short-term Oil Demand
- The IEA recorded its largest drop in oil demand since April with a 420 kb/d decrease from last month to reach a total demand decline of 8.78 mb/d. OPEC's assessment was down by 280 kb/d for an overall demand decline of 9.75 mb/d – OPEC's largest overall decline of the year. The IEA, however, continues to be optimistic on Chinese demand which is set to increase by 80 kb/d in 2020.
24th Meeting of the Joint Ministerial Monitoring Committee (JMMC)
- At the 24th JMMC Monitoring Committee that met on 17 November, HE Prince Abdulaziz bin Salman, Minister of Energy, Saudi Arabia urged all the participants in the Declaration of Cooperation to renew their determination to abide by the terms of the agreement that has greatly contributed to the balancing of global markets.
2. Key Points
2.1 Demand
The IEA records its largest demand decline since April while OPEC posts its largest decline of the year.
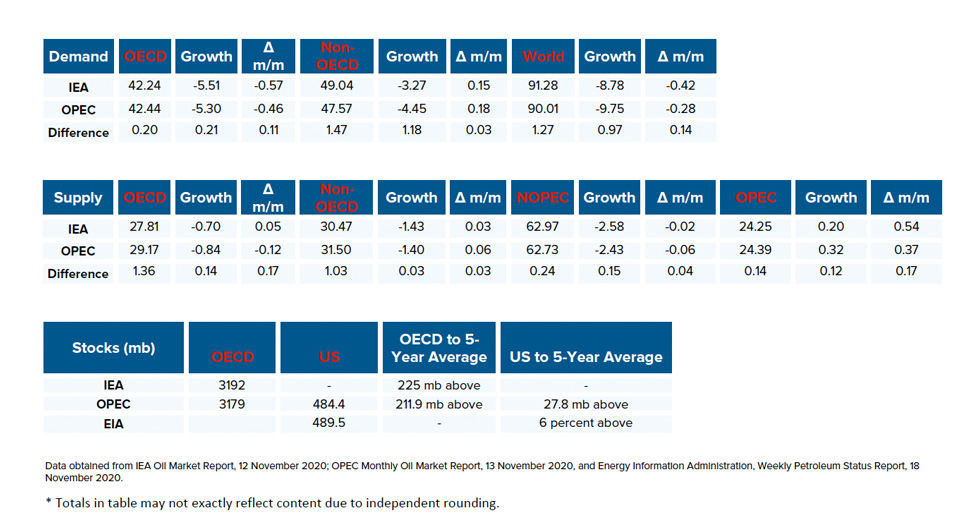
- The IEA reported a demand decrease of 420 kb/d and a year-on-year (y-o-y) demand decline of -8.78 mb/d due to uncertainty caused by COVID-19 in various countries.
- OPEC's demand forecast decreased by 280 kb/d for a y-o-y demand decline of -9.75 mb/d – OPEC's largest decline of the year. The IEA and OPEC estimates for absolute world demand are now 91.28 mb/d and 90.01 mb/d, respectively.
The IEA and OPEC continue to diverge on non-OECD demand.
- The IEA's estimate for OECD demand decreased by 570 kb/d to reach a total decline of -5.51 mb/d for 2020. OPEC's estimate decreased by 460 kb/d to reach a demand decline of -5.30 mb/d.
- The IEA's non-OECD demand assessment increased by 150 kb/d for a total demand decline of -3.27mb/d, while OPEC reports an increase of 180 kb/d for an overall decline of -4.45 mb/d.
- The IEA and OPEC differ by 0.21 kb/d and 1.18 kb/d on OECD and non-OECD demand decline, respectively.
2.2 Supply
Both the IEA and OPEC's non-OPEC supply projections decreased slightly.
- The IEA's November assessment for non-OPEC supply is down by 20 kb/d to reach a total decline of -2.58 mb/d while OPEC's assessment decreased by 60 kb/d for a total decline of -2.43 mb/d. In absolute values, the IEA and OPEC estimate non-OPEC supply at 62.97 mb/d and 62.73 mb/d respectively for 2020.
- The IEA reports OECD supply declines at -0.70 mb/d, up by 50 kb/d. OPEC records OECD declines at -0.84 mb/d, a decrease of 120 kb/d from last month. In absolute values, the IEA and OPEC estimate OECD supply at 27.81 mb/d and 29.17 mb/d, respectively for 2020 diverging by 1.36 mb/d.
Both the IEA and OPEC post slight increases to non-OECD supply.
- The IEA's supply assessment increased by 30 kb/d for a total decline of -1.43 mb/d while OPEC's forecast increased by 60 kb/d for a total decline of -1.40 mb/d. In absolute values, the IEA and OPEC non-OECD supply estimates are 30.47 mb/d and 31.50 mb/d respectively for 2020 diverging by 1.03 mb/d.
Both the IEA and OPEC report increases in OPEC production in October with increases coming primarily from Libya and Iraq.
- The IEA revised its OPEC production by 200 kb/d m-o-m in October to reach total production of 24.25 mb/d. OPEC also reported an increase by 320 kb/d month-on-month (m-o-m) for total production of 24.39 mb/d in October.
2.3 Stocks
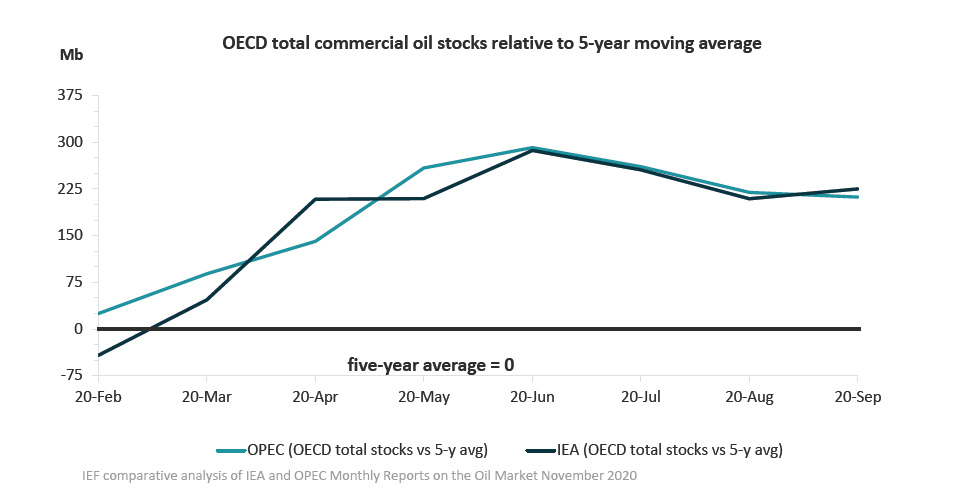
The IEA and OPEC continue to report strong alignment on stock figures. The IEA reports OECD stock levels at 3192 mb, which is close to OPEC's assessment of 3179 mb for OECD stock that is 225 mb and 211.9 mb above the five-year average, respectively. The divergence between OPEC and the IEA stands at 13 mb. Total US crude inventories (excluding SPR) amount to about 490 mb according to the US Energy Information Administration (EIA) which are about 6 percent above the five-year average for this time of year. OPEC reports US commercial crude stocks at about 484 mb and around 28 mb above the five-year average.
2.4 Snapshot (mb/d)
3. Global Analysis
3.1 Demand Data
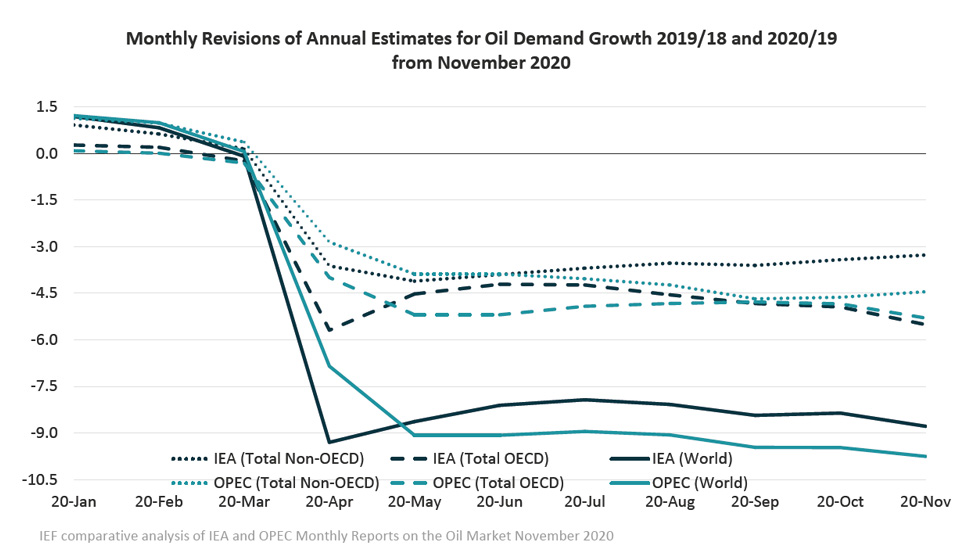
Figure 1
IEA and OPEC demand decreases further
IEA and OPEC Non-OECD demand disparity persists
Absolute Demand
- The IEA's estimate for global demand declined to -8.78 mb/d in November, a decrease of 420 kb/d, for an absolute demand of 91.28 mb/d in 2020. OECD demand decreased by 570 kb/d due to a rebound in COVID-19 cases across Europe and North America.
- As the traditional driver of demand growth, demand in non-OECD Asia increased for the second consecutive month from -1.50 mb/d in October to -1.33 in November according to the IEA.
- OPEC's global demand assessment decreased by 280 kb/d for a total decline of -9.75 mb/d in 2020 with absolute demand at 90.01 mb/d.
- Global demand is expected to recover by 5.80 mb/d and 6.25 mb/d in 2021 according to the IEA and OPEC, respectively.
OECD Demand
- The IEA reports an OECD oil demand decline of -5.51 mb/d, down from last month's figure of -4.94 mb/d with the Americas comprising most of the decrease at -2.99 mb/d. The IEA anticipates total OECD consumption for 2020 at 42.24 mb/d.
- OPEC's demand projection for the OECD region decreased by 460 kb/d to reach a demand decline of -5.30 mb/d with the Americas comprising most of the decrease at -2.66 mb/d for an absolute 2020 demand at 42.44 mb/d.
Non-OECD Demand
- The IEA and OPEC anticipate declines in non-OECD demand for this year of -3.27 mb/d and -4.45 mb/d, respectively, diverging by 1.18 mb/d. This is driven largely by Asia, Middle East, and the Americas. Total non-OECD demand forecasts average 49.04 mb/d and 47.57 mb/d, respectively, diverging by 1.47 mb/d.
China Demand
- Overall demand in 2020 will be 13.78 mb/d, an increase of 80 kb/d from last year and demand is expected to rise by 830 kb/d in 2021 according to the IEA.
- Overall demand in 2020 will be 12.53 mb/d, a drop of 770 kb/d, but demand is expected to recover by 1.10 mb/d in 2021 according to OPEC.
India Demand
- According to the IEA, Indian demand is expected to drop by 460 kb/d in 2020 to reach a total demand of 4.65 mb/d with a recovery by 370 kb/d in 2021.
- Overall demand will decline by 800 kb/d with total demand of 4.04 mb/d in 2020. Demand will recover by 570 kb/d in 2021 according to OPEC.
3.2 Supply Data
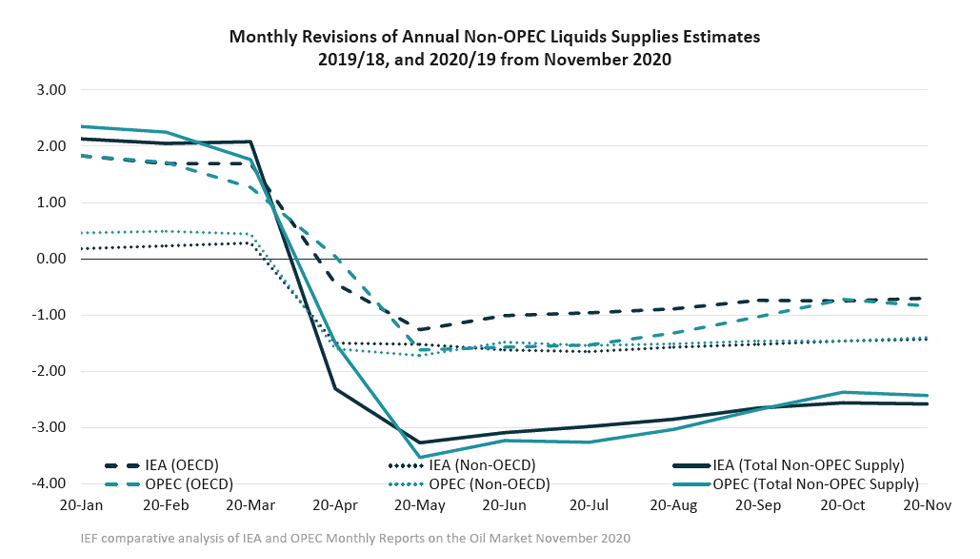
Figure 2
IEA and OPEC Non-OPEC supply estimates decreased slightly
IEA and OPEC OECD estimates diverge slightly
Non-OPEC Supply
- The IEA forecasts non-OPEC supply at 62.97 mb/d with an adjusted supply drop of -2.58 mb/d for 2020, a decrease of 20 kb/d compared to last month. In 2021, non-OPEC production will see a modest recovery of 480 kb/d.
- OPEC's November assessment of total non-OPEC supply for 2020 stands at 62.73 mb/d. Supply decreased by 60 kb/d with a total decline of -2.43mb/d. Most of the decline comes from Russia (-1.09 mb/d), the US (-0.72 mb/d), and Canada (-0.33 mb/d). Norway, Brazil, and China are forecast to be the key drivers of growth.
OECD Supply
- The IEA forecasts OECD supplies to decline by -0.70 mb/d for 2020 while OPEC reports a decline at -0.84 mb/d with total supply reaching 27.81 mb/d and 29.17 mb/d respectively in 2020 and diverging by 1.36 mb/d.
- The IEA's data shows that OECD Americas oil supply declines by 0.93 mb/d to reach 23.72 mb/d in total. OPEC reports a decline of -1.06 mb/d with total oil supply reaching 24.71 mb/d in 2020.
- The IEA's assessment for OECD Europe supply records an increase by 210 kb/d for total production of 3.55 mb/d led primarily by Norway. OPEC's assessment for total OECD Europe production in 2020 is 3.91 mb/d with a growth of 200 kb/d.
OPEC Supply
- The IEA reports that OPEC production increased by 200 kb/d m-o-m in October to reach total production of 24.25 mb/d led by Libya and Iraq.
- OPEC reports that total OPEC-13 crude oil production averaged 24.39 mb/d in October according to secondary sources which is an increase of 320 kb/d m-o-m. Crude oil output increased primarily in Libya, Iraq, and Nigeria.
3.3 Stock Data
- IEA data shows OECD commercial inventories fell by 19.7 mb m-o-m in September to 3192 mb and are 225 mb above the five-year average. Crude inventories dropped by only 3.1 mb while product stocks fell by 12.2 mb. Other oils, including NGLs and feedstocks, also drew by 4.4 mb.
- According to OPEC, preliminary data for September showed that total OECD commercial oil fell by 15.3 mb m-o-m to 3179 mb and are now 211.9 mb above the latest five-year average. Unlike the IEA, OPEC estimates most draws occurred in crude stocks (13.0 mb) while product stocks only dropped by 2.2 mb. OPEC estimates crude inventories in OECD Americas fell by 17.0 mb m-o-m compared to IEA's estimate of a 6.8 mb decline.
JODI Data:
- US crude oil closing stock levels fell by 16.51 mb m-o-m in September to 1135 mb.
- Japanese crude oil stock levels in August were revised downward by 7.54 mb and its September figure rose m-o-m by 1.89 mb m-o-m to 383.24 mb.
- Korean crude oil closing stock levels rose by 2.98 mb m-o-m in September to 126.75 mb.
- German crude oil closing stock levels in September were revised downward by 3.03 mb and its September figure rose m-o-m by 3.13 mb to 155.69 mb.
- UK crude oil closing stock levels fell by 3.06 mb m-o-m in September to 25.35 mb.
While both the IEA and OPEC report closely aligned data on OECD stocks due to a continuous and reliable data stream and data harmonisation efforts, comprehensive data on stock developments for non-OECD countries is still work in progress as large differences in assessments show.
Figure 3
IEA and OPEC data show alignment on OECD stock builds
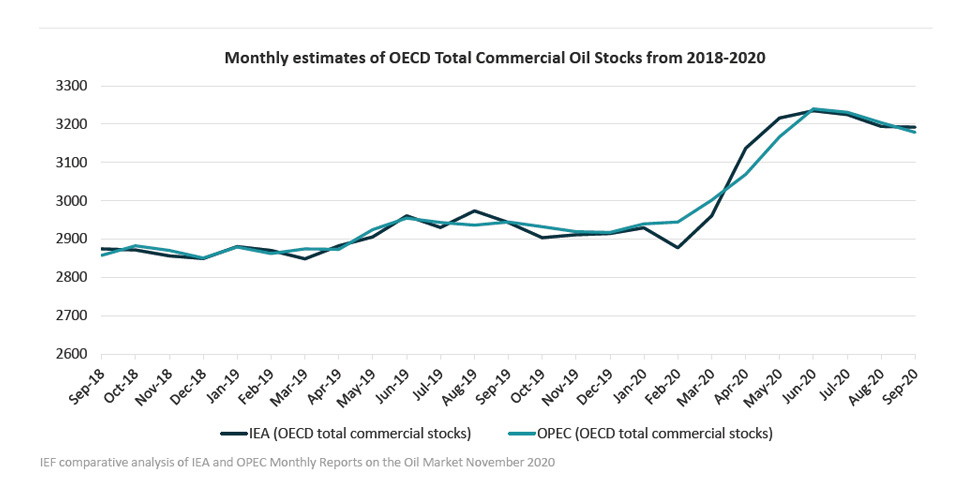
Figure 4
Stock decline rates by the IEA and OPEC converge
OECD stocks remain well above five-year average
3.3.1 Global Stock Analysis
IEA, JODI, and available weekly inventory data imply crude, NGL, and product stocks fell by ~55.6 mb in 3Q20, including a 61.7 mb draw in September.
- Floating crude inventories declined by 30.4 mb in September led by a 25.4 mb drop in Asia. Floating crude fell by an additional 11.2 mb in October to stand ~95 mb below their summer peak but remaining >60 mb above their five-year average.
- Rapidan Energy Group's preliminary global inventory estimate for October shows visible inventories tumbled by 97 mb led by a 49.5 mb decline in OECD commercial and SPR stocks. Meanwhile, non-OECD crude inventories drew by an additional 31.0 mb.
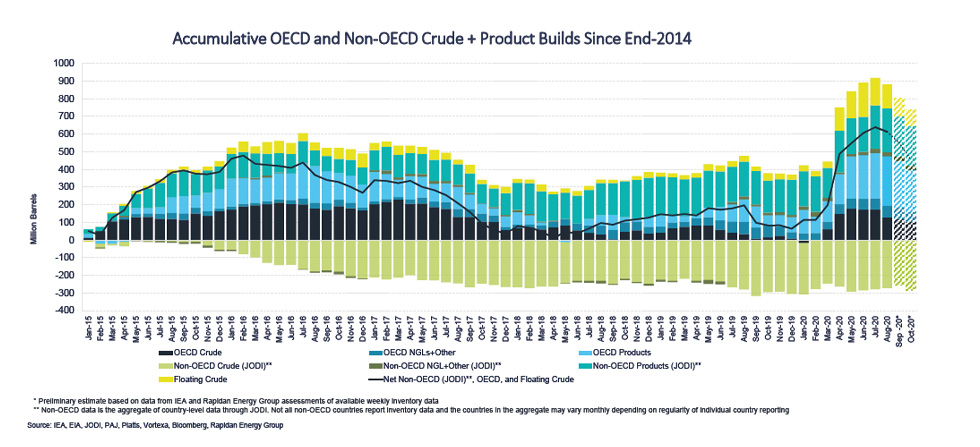
- Preliminary data suggests 3Q20 global inventories drew by ~55.6 mb, led by a ~91.1 mb drop in floating crude. Steep draws in OECD inventories and floating crude stocks were partially offset by a ~68.7 mb build across non-OECD inventories. Notably, JODI non-OECD crude and product inventory data for July and August show a net 31.3 mb build in Indonesia and a 26.8 mb build in China.
- IEA and OPEC's 1H20 global oil balances continue to imply the market was oversupplied by ~1.3-1.5 billion barrels. Only ~25% of the oversupply appeared in OECD commercial and government inventory data. IEA's China crude balance implies another ~20% of 1H20's oversupply flowed into Chinese crude stocks. An additional ~10% appeared in floating crude data. Only ~2% is accounted for in available JODI non-OECD stock data.
Table 1
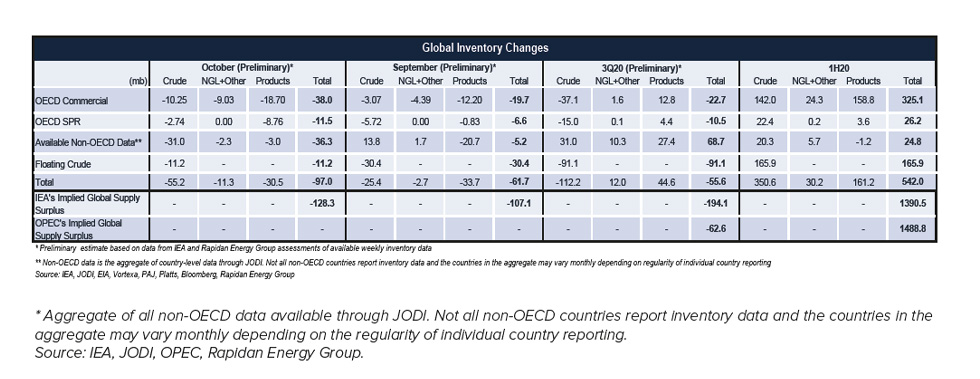
* Aggregate of all non-OECD data available through JODI. Not all non-OECD countries report inventory data and the countries in the aggregate may vary monthly depending on the regularity of individual country reporting. Source: IEA, JODI, OPEC, Rapidan Energy Group.
Figure 5
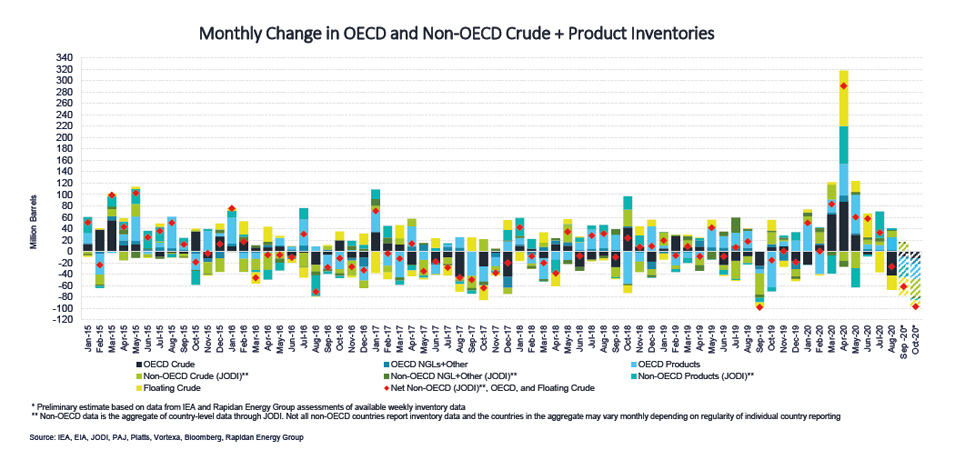
Figure 6
Explanatory Note
The IEF conducts a comprehensive comparative analysis of the short-, medium-, and long-term energy outlooks of the IEA and OPEC, to inform the IEA-IEF-OPEC Symposium on Energy Outlooks that the IEF hosts in Riyadh as part of the trilateral work programme on a yearly basis.
To inform IEF stakeholders on how perspectives on the oil market of both organisations evolve over time more regularly, this monthly summary provides:
- An overview of key events and initiatives in the international policy and market context.
- Key findings and a snapshot overview of data points gained from comparing basic historical data and short-term forecasts of the IEA Oil Market Report and the OPEC Monthly Oil Market Report.
- A comparative analysis of oil inventory data reported by JODI, the IEA, OPEC, the US EIA and secondary sources in collaboration with the Rapidan Energy Group.
The International Energy Forum
The IEF is the neutral facilitator of informal, open, informed and continuing global energy dialogue. Covering all six continents, the IEF is unique in that it comprises not only countries of the IEA and OPEC, but also key players including China, India, Russia and South Africa. The Forum's biennial Ministerial Meetings are the world's largest gathering of Energy Ministers. Through the Forum and its associated events, IEF Ministers, their officials, energy industry executives, and other experts engage in a dialogue of increasing importance to global energy security and orderly energy transitions. The IEF and the global energy dialogue are promoted by a permanent Secretariat of international staff based in the Diplomatic Quarter of Riyadh, Saudi Arabia. For more information visit www.ief.org.