")

Comparative Analysis of Monthly Reports on the Oil Market
1. International Policy and Market Context
Attacks on Energy Infrastructure Threaten Energy Supplies and Global Economic Stability
- The Secretary General of the International Energy Forum (IEF) Joseph McMonigle condemned the attempted attacks on oil facilities at the Ras Tanura Port and surrounding areas in Saudi Arabia on 7 March and the drone attack on refinery installations in Riyadh on 20 March. Attacks threaten global energy supplies and world economic stability when the economy is just beginning to recover from the shock of the COVID-19 pandemic. The attacks briefly pushed oil prices above $70 a barrel for the first time since January 2020.
IEA Forecasts Return of Gasoline Demand to Pre-Pandemic Levels in Doubt
- Gasoline is not likely to return to pre-pandemic levels, according to the latest IEA medium-term oil forecast through 2026. An accelerating global shift toward electric vehicles, along with increasing fuel efficiency among gasoline-powered fleets, may outweigh gasoline demand growth from developing countries.
US crude oil production sees largest year-on-year decline on record
- U.S. crude oil production averaged 11.3 mb/d in 2020, down 935,000 kb/d (8 percent) from the record annual average high of 12.2 mb/d in 2019. The 2020 decrease in production was the largest annual decline in the U.S. Energy Information Administration's records. The production decline resulted from reduced drilling activity related to low oil prices in 2020 along with the sudden drop in petroleum demand due to COVID-19.
14th OPEC and non-OPEC Ministerial Meeting Keeps Production Adjustments in Place
- OPEC and non-OPEC Ministers decided to maintain supply adjustments on 4 March while Saudi Arabia extended the additional voluntary adjustments of 1 mb/d for the month of April 2021. Ministers decided that only Russia and Kazakhstan will be allowed to increase production due to seasonal consumption patterns.
2. Key Points
2.1 Demand
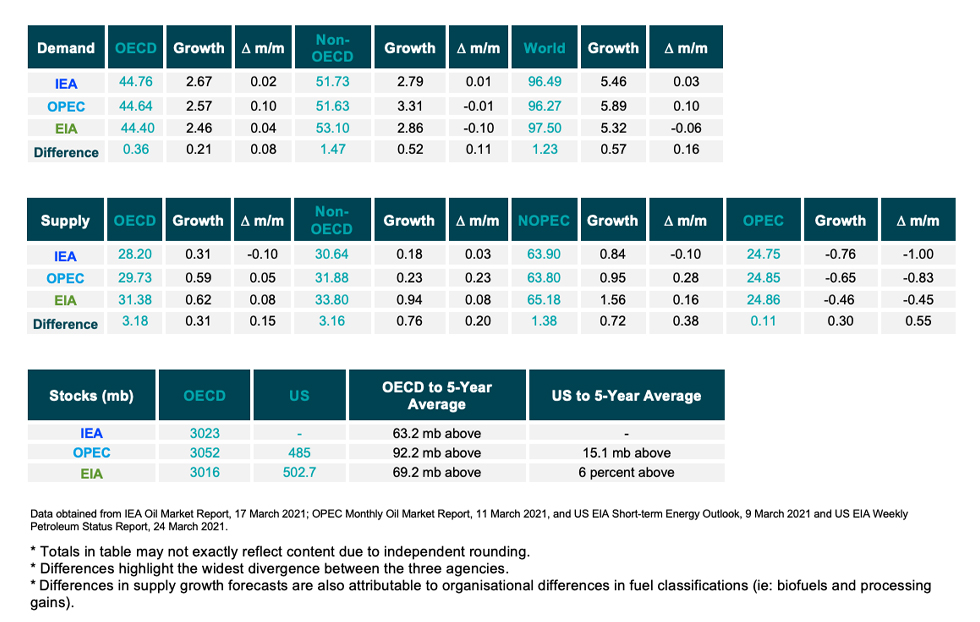
IEA, OPEC, and EIA demand growth assessments remain steady.
- The IEA increased its assessment by 30 kb/d for a year-on-year (y-o-y) demand growth of 5.46 mb/d due to colder than expected weather at the start of the year, positive economic outlook, and the continued rollout of vaccines.
- OPEC's forecasts a y-o-y demand growth of 5.89 mb/d, an increase of 100 kb/d from last month.
- EIA's assessment decreased by 60 kb/d for a demand growth of 5.32 mb/d in 2021. The IEA, OPEC, and EIA estimates for absolute world demand are now 96.49 mb/d 96.27 mb/d, and 97.50 mb/d for 2021, respectively.
IEA, OPEC, and EIA align on OECD and non-OECD demand growth.
- The IEA's non-OECD demand assessment increases by 10 kb/d to a demand growth of 2.79 mb/d, while OPEC decreases its assessment by 10 kb/d for a growth of 3.31 mb/d. The EIA's assessment decreases by 100 kb/d for non-OECD demand growth of 2.86 mb/d y-o-y.
- The IEA's estimate for OECD demand increased by 20 kb/d for demand growth at 2.67 mb/d for 2021. OPEC's estimate increased by 100 kb/d for a demand growth at 2.57 mb/d while EIA's assessment sees growth at 2.46 mb/d y-o-y, an increase of 40 kb/d.
- The IEA and EIA assessments differ by 0.21 mb/d and IEA and OPEC assessments differ by 0.52 mb/d on OECD and non-OECD demand growth, respectively.
2.2 Supply
IEA, OPEC, and EIA show differences in non-OPEC supply growth.
- The IEA's March assessment for non-OPEC supply decreases by 100 kb/d for a total growth of 0.84 mb/d while OPEC reports total growth of 0.95 mb/d, an increase of 280 kb/d. The EIA reports a higher overall supply growth of 1.56 mb/d y-o-y, an increase of 160 kb/d from last month’s assessment. In absolute values, the IEA, OPEC, and EIA estimate non-OPEC supply at 63.90 mb/d, 63.80 mb/d, and 65.18 mb/d, respectively for 2021.
- The IEA reports OECD supply growth at 0.31 mb/d while OPEC records OECD growth at 0.59 mb/d, a decrease and increase of 100 kb/d and 50 kb/d, respectively. The EIA also records a growth of 0.62 mb/d, an increase of 80 kb/d. In absolute values, the IEA and OPEC, and EIA estimate OECD supply at 28.20 mb/d, 29.73 mb/d, and 31.38 mb/d, respectively for 2021. Divergence on OECD supply growth is the largest between the IEA and EIA differing by 310 kb/d.
EIA reports higher non-OECD supply growth than the IEA and OPEC.
- The IEA's supply assessment reaches total supply growth of 0.18 mb/d, an increase of 30 kb/d from last month. OPEC’s forecast reports a growth of 0.23 mb/d, an increase of 230 kb/d from last month. The EIA is substantially more optimistic showing non-OECD supply growth of 0.94 mb/d, an increase of 80 kb/d from last month. In absolute values, the IEA, OPEC, and EIA non-OECD supply estimates are 30.64 mb/d and 31.88 mb/d, and 33.80 mb/d, respectively for 2021. Divergence on total non-OECD supply growth is again widest between the IEA and EIA that differ by 760 kb/d.
IEA, OPEC, and EIA all report decreases in OPEC production in February.
- The IEA revised its OPEC production estimate downward by 760 kb/d month-on-month (m-o-m) in February to reach total production of 24.75 mb/d. OPEC also reported a decrease by 650 kb/d m-o-m for total production of 24.85 mb/d in February. The EIA, meanwhile, decreased its assessment by 460 kb/d for total OPEC crude production of 24.86 mb/d in February.
2.3 Stocks
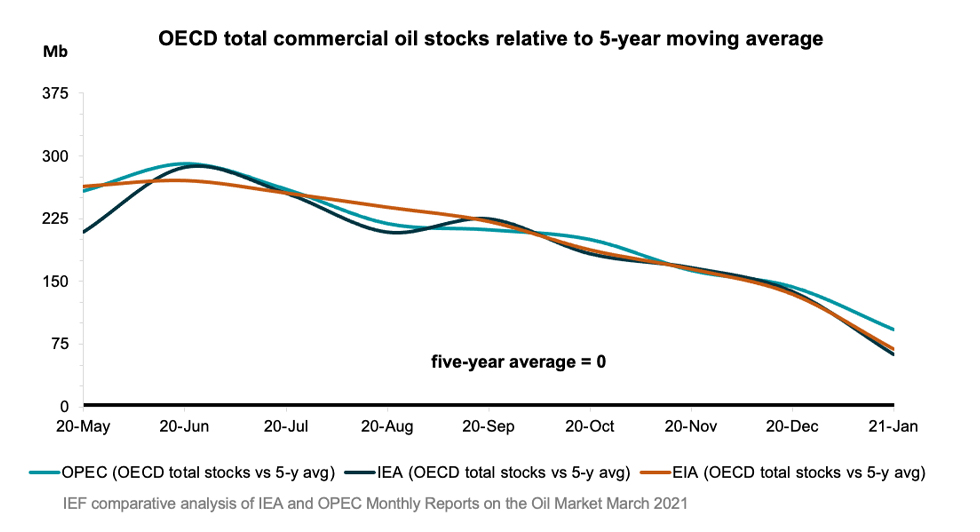
IEA, OPEC, and EIA continue to report strong alignment on stock figures. The IEA reports OECD stock levels at 3023 mb, which is close to OPEC’s assessment of 3052 mb and EIA’s assessment of 3016 mb, or for OECD stock that is 63.2 mb, 92.2 mb, and 69.2 mb above the five-year average, respectively. The widest divergence between OPEC, and the EIA stands at 36 mb. Total US crude inventories (excluding SPR) amount to about 503 mb according to the EIA which are 6 percent above the five-year average for this time of year. OPEC reports US commercial crude oil stocks at about 485 mb and around 15 mb above the five-year average.
2.4 Snapshot (mb/d)
3. Global Analysis
3.1 Demand Data
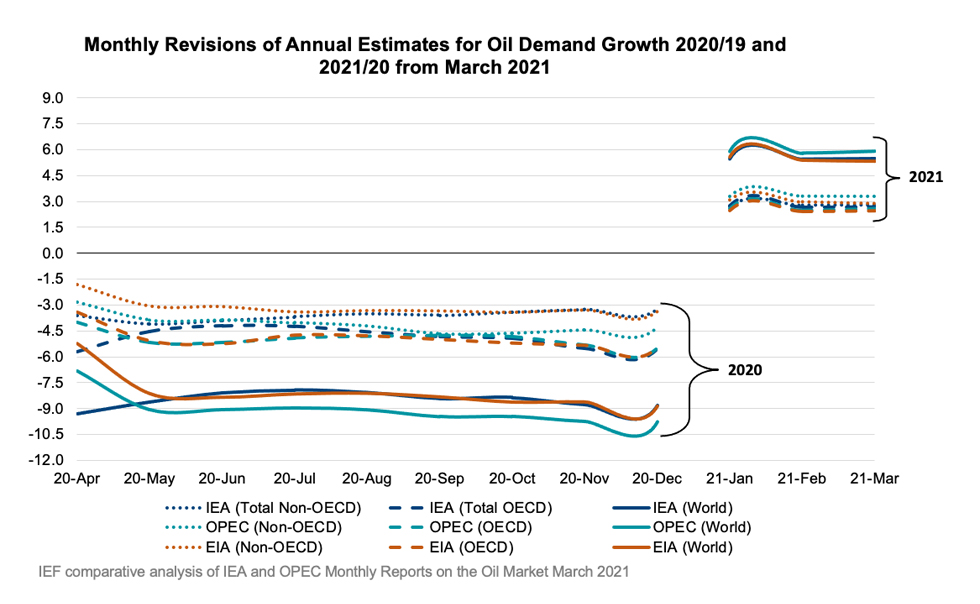
Figure 1
IEA, OPEC, and EIA demand growth remains steady
OPEC reports higher demand growth than IEA and EIA
Absolute Demand
- The IEA's estimate for global demand growth increased slightly to 5.46 mb/d in March for an absolute demand of 96.49 mb/d in 2021 due to positive economic sentiment and the faster rollout of vaccines.
- OPEC's global demand assessment increases by 100 kb/d for a total y-o-y increase of 5.89 mb/d in 2021 with absolute demand at 96.27 mb/d.
- The EIA revised its assessment down by 60 kb/d with a demand growth of 5.32 mb/d y-o-y for an absolute demand of 97.50 mb/d.
OECD Demand
- The IEA increases its assessment by 20 kb/d for OECD oil demand growth of 2.67 mb/d with the Americas comprising most of the increase at 1.64 mb/d. The IEA anticipates total OECD consumption for 2021 at 44.76 mb/d.
- OPEC's demand projection for the OECD region increased by 100 kb/d for y-o-y growth of 2.57 mb/d with the Americas comprising most of the increase at 1.69 mb/d for absolute demand at 44.64 mb/d.
- The EIA's assessment for OECD demand growth increases by 40 kb/d to 2.46 mb/d with the Americas comprising most of the increase at 1.68 mb/d for an absolute demand at 44.40 mb/d.
Non-OECD Demand
- The IEA, OPEC, and EIA anticipate increases in non-OECD demand growth for this year of 2.79, mb/d, 3.31 mb/d, and 2.86 mb/d, respectively. Divergence is largest between the IEA and OPEC that differ by 520 kb/d. Demand is driven largely by Asia, Middle East, and the Americas. Total non-OECD demand forecasts average 51.73 mb/d, 51.63 mb/d, and 53.10 mb/d, respectively. OPEC and the EIA estimates diverge most by 1.47 mb/d.
China Demand
- According to the IEA, demand in 2021 will be 14.78 mb/d, an increase of 850 kb/d from last year.
- According to OPEC demand in 2021 will be 14.20 mb/d, an increase of 1.11 mb/d from last year.
- Demand in 2021 will be 15.15 mb/d, an increase of 820 kb/d from last year according to the EIA.
- The EIA and OPEC demand growth estimates diverge most with 290 kb/d between them.
India Demand
- According to the IEA, Indian demand is expected to increase by 440 kb/d in 2021 to reach a total demand of 4.98 mb/d.
- Demand will increase by 600 kb/d with total demand reaching 4.99 mb/d in 2021, according to OPEC.
- The EIA forecasts total demand at 4.89 mb/d in 2021, an increase of 520 kb/d from last year.
- The IEA and OPEC demand growth estimates diverge most differing by 160 kb/d.
3.2 Supply Data
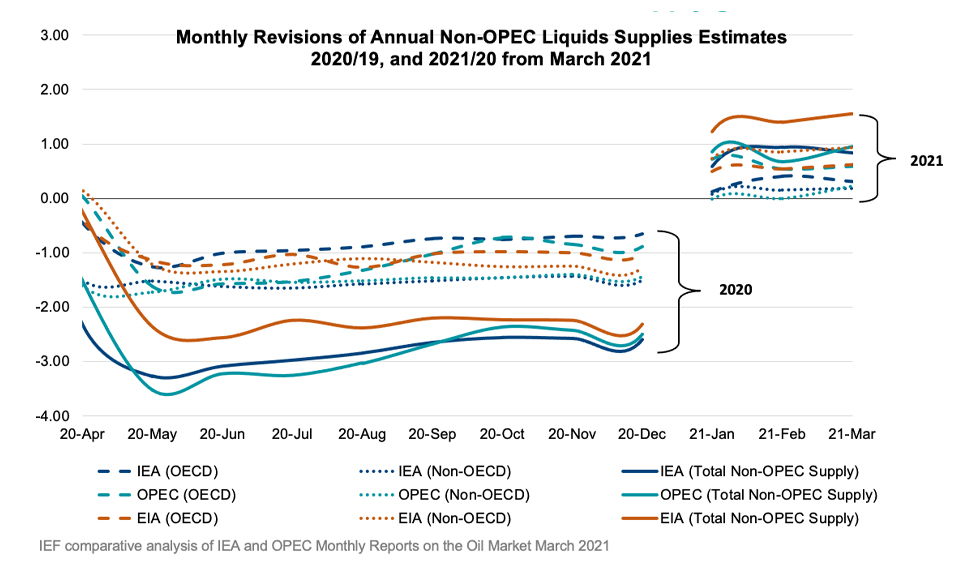
Figure 2
IEA, OPEC, and EIA supply growth estimates vary strongly
EIA differs most on non-OPEC and non-OECD supply growth
Non-OPEC Supply
- The IEA forecasts non-OPEC supply at 63.90 mb/d, adjusting supply growth by 0.84 mb/d for 2021; a decrease of 100 kb/d from last month’s report. Most of the growth comes from Canada (0.38 mb/d), Norway (0.16 mb/d), Brazil (0.16 mb/d), and Russia (0.11 mb/d).
- OPEC's March assessment of total non-OPEC supply for 2021 stands at 63.80 mb/d for a total growth of 0.95 mb/d, an increase of 280 kb/d from the February report. Most of the growth comes from Canada (0.30 mb/d), US (0.16 mb/d), Norway (0.15 mb/d), and Brazil (0.14 mb/d).
- EIA's assessment shows non-OPEC supply grows by 1.56 mb/d reaching 65.18 mb/d this year. Most of the growth comes from Canada (0.43 mb/d), Brazil (0.41 mb/d), US (0.21 mb/d), and Norway (0.18 mb/d).
- The largest divergence in non-OPEC supply growth estimates is between the IEA and EIA that differ by 720 kb/d.
OECD Supply
- The IEA forecasts OECD supplies to increase by 0.31 mb/d for 2021 while OPEC and the EIA see growth at 0.59 mb/d and 0.62 mb/d with total supply reaching 28.20 mb/d, 29.73 mb/d, and 31.38 mb/d, respectively in 2021. Divergence in growth is largest between the IEA and EIA that differ by 310 kb/d with EIA showing twice as much growth as the IEA forecasts.
- The IEA's data shows that OECD Americas oil supply increases by 180 kb/d to reach 24.00 mb/d in total. OPEC reports an increase of 450 kb/d with total oil supply reaching 25.17 mb/d in 2021. The EIA reports an increase of 600 kb/d for a total supply of 26.43 mb/d.
- The IEA's assessment for OECD Europe supply records an increase by 100 kb/d for total production of 3.64 mb/d led primarily by Norway. OPEC's assessment for total OECD Europe production in 2021 is 4.03 mb/d with a growth of 140 kb/d. The EIA reports an increase of 110 kb/d for a total supply of 4.39 mb/d.
OPEC Supply
- The IEA reports that OPEC production decreased by 760 kb/d m-o-m in February to reach total production of 24.75 mb/d. Output increased in Nigeria, Iraq, Venezuela and decreased in Saudi Arabia and Iran.
- OPEC reports that total OPEC-13 crude oil production averaged 24.85 mb/d in February according to secondary sources which is a decrease of 647 kb/d m-o-m. Crude oil output increased primarily in Nigeria, Iraq, Iran, Venezuela, and Libya while production decreased primarily in Saudi Arabia and Angola.
- The EIA reports OPEC production decreased by 460 kb/d m-o-m in February for a total production of 24.86 mb/d.
3.3 Stock Data
- IEA data shows OECD commercial inventories fell by 14.2 mb m-o-m in January to 3023 mb and are 63.2 mb above the five-year average. Crude oil inventories dropped by 23.7 mb while product stocks fell by only 0.3 mb. Other oils, including NGLs and feedstocks drew by 9.3 mb.
- According to OPEC, preliminary data for December showed that total OECD commercial oil inventories fell by 11.3 mb m-o-m to 3052 mb and are now 92.2 mb above the latest five-year average. OPEC estimates a crude draw of 17.7 mb while product stocks built by 6.4 mb.
- EIA estimates OECD inventories dropped by 16.8 mb in January to 3016 mb – 69.2 mb above the five-year average.
JODI Data:
- US crude oil closing stock levels fell by 12.52 mb m-o-m in January to a yearly low of 1110.83 mb.
- Korean crude oil closing stock levels fell by 1.9 kb m-o-m in January to 123.43 mb.
- German crude oil closing stock levels in January fell m-o-m by 1.48 kb to 152.72 mb.
- UK crude oil closing stock levels in January fell m-o-m by 4.60 mb to 2.37 mb – the lowest level since monitoring began in January 2002.
While both the IEA and OPEC report closely aligned data on OECD stocks due to a continuous and reliable data stream and data harmonisation efforts, comprehensive data on stock developments for non-OECD countries is still work in progress as large differences in assessments show.
Figure 3
IEA, OPEC, and EIA data show alignment on OECD stock builds
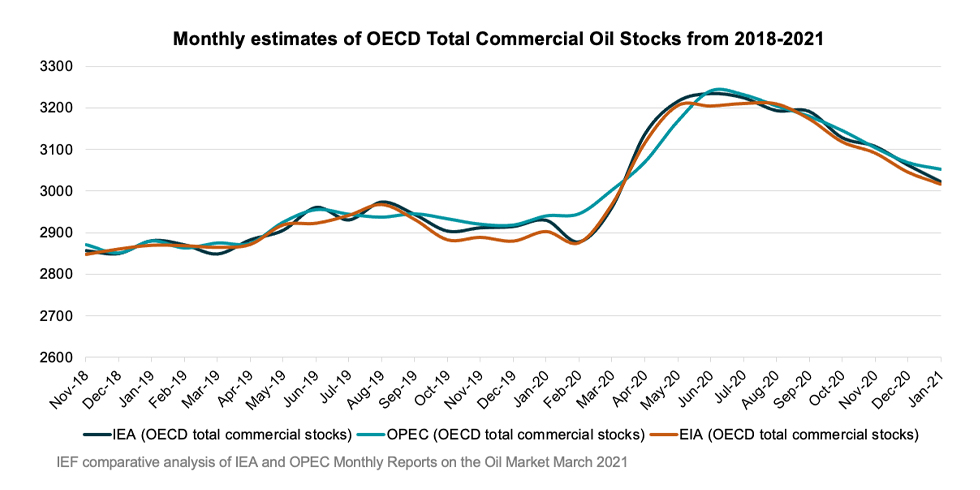
Figure 4
OPEC reports higher five-year average than IEA and EIA
OECD stocks remain well above five-year average
3.3.1 Global Stock Analysis
IEA, JODI, and available weekly inventory data for January imply crude, NGL, and product stocks built by ~16.3 mb
- JODI non-OECD data for January shows inventories increased by 11.0 mb led by a 6.8 mb build in products. Products built in India (8.6 mb), Saudi Arabia (2.5 mb), and Thailand (2.2 mb). Crude stocks built in Nigeria (8.6 mb) and Chinese Taipei (2.9 mb).
- Floating crude inventories increased by 18.8 mb in January but fell by 6.5 mb in February. They are now 127.2 mb below their June peak.
- Rapidan Energy Group's preliminary global inventory estimate for February returned to draws with visible inventories tumbling by 62.1 mb. Early data shows OECD commercial inventories dropped for a seventh consecutive month in February, falling by 51.9 mb with a 50.7 mb m/m drop in OECD commercial products.
- February's large m/m drop in OECD products (50.7 mb) was driven by strong draws in the US. Distillate (19.8 mb), propane and propylene (14.8 mb), and gasoline (8.7 mb) drove the declines in the US.
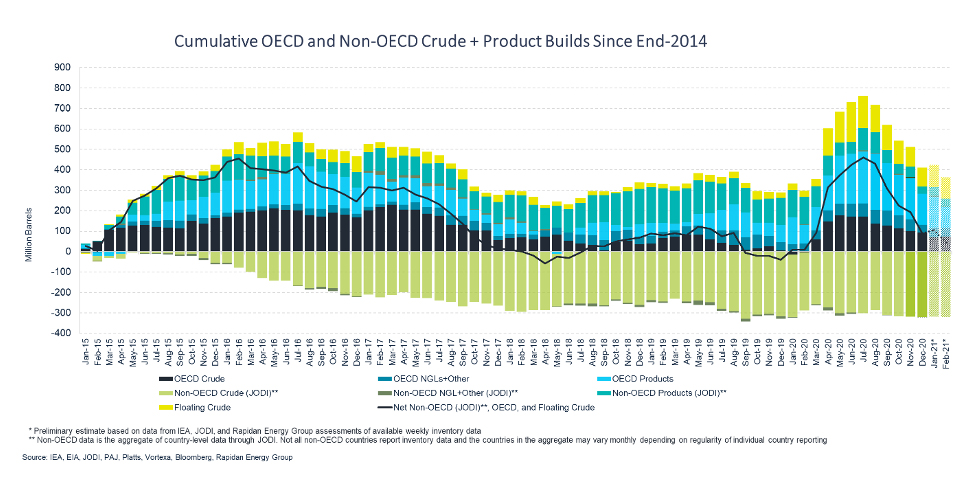
- Stock data shows global inventories drew by ~302.3 mb in 2H20, led by a 175.3 mb drop in total OECD stocks and a 68.1 mb drop in floating crude. We estimate that a little above 70% of 1H20 historic builds were wiped in the second half of the year.
Table 1
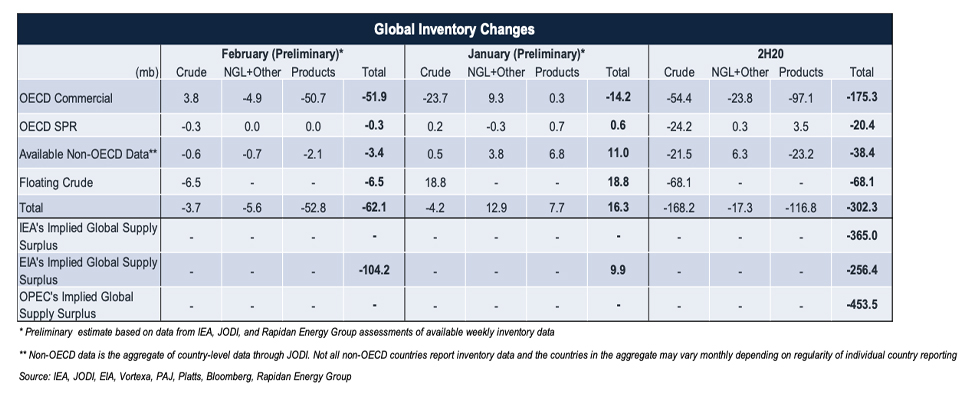
Figure 5
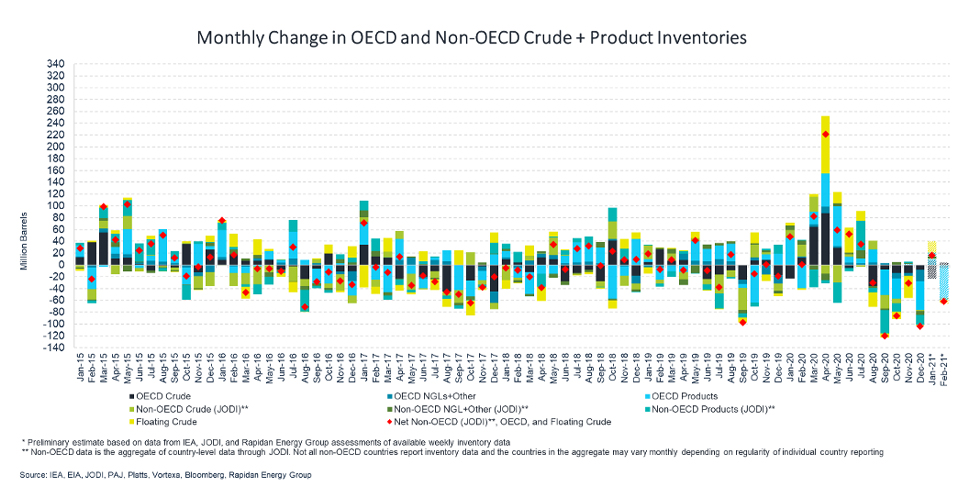
Figure 6
Explanatory Note
The IEF conducts a comprehensive comparative analysis of the short-, medium-, and long-term energy outlooks of the IEA OPEC, and the EIA to inform the IEA-IEF-OPEC Symposium on Energy Outlooks that the IEF hosts in Riyadh as part of the trilateral work programme on a yearly basis.
To inform IEF stakeholders on how perspectives on the oil market of both organisations evolve over time regularly, this monthly summary provides:
- An overview of key events and initiatives in the international policy and market context.
- Key findings and a snapshot overview of data points gained from comparing basic historical data and short-term forecasts of the IEA Oil Market Report and the OPEC Monthly Oil Market Report.
- A comparative analysis of oil inventory data reported by JODI, the IEA, OPEC, and the US EIA, and secondary sources in collaboration with the Rapidan Energy Group.
The International Energy Forum
The International Energy Forum is the leading global facilitator of dialogue between sovereign energy market participants. It incorporates members of International Energy Agency and the Organization of the Petroleum Exporting Countries, and also key players including China, India, Russia and South Africa. The forum's biennial ministerial meetings are the world's largest gathering of energy ministers, where discussions focus on global energy security and the transition towards a sustainable and inclusive energy future. The forum has a permanent secretariat of international staff based in the Diplomatic Quarter of Riyadh, Saudi Arabia. For more information visit www.ief.org.